Posts

Business Objects Live Office

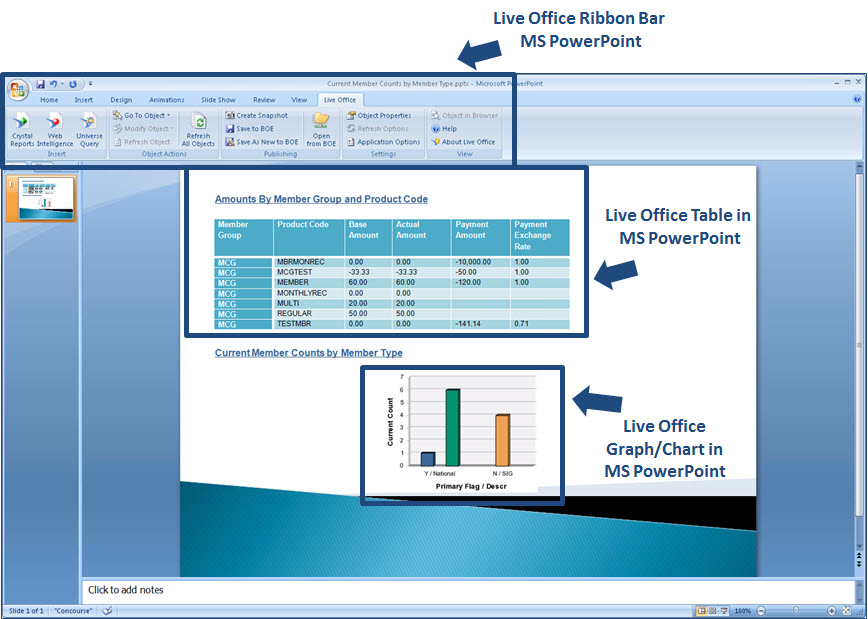
Live Office from SAP Business Objects integrates business intelligence functionality from the Business Objects suite within the commonly-used Microsoft Office environment. Subsequently Live Office enables users are able to embed refreshable information within documents, spreadsheets, and presentations and share them across their organization. Live Office provides users with real-time data that is verifiable and easily refreshed. As Live Office is built directly into Microsoft Office applications, needed information is available at the user’s finger tips and is available in a familiar, easy to use format. In a nutshell, Live Office empowers business users to easily access corporate data from within Microsoft Office Excel, Word, Outlook, and PowerPoint without depending on expertise from the information technology department.

Live Office PowerPoint Sample

Benefits of Business Objects Live Office
•  Access business intelligence (BI) content directly within Microsoft Office.
•  Embed business intelligence directly in your e-mail messages using Microsoft Outlook.
•  Format and perform calculations using familiar features of Excel, PowerPoint, and Word.
•  Increase business user autonomy by exposing corporate data in Microsoft Office documents, spreadsheets, and presentations rather than web applications.
•  Improve timelines of decisions by enabling simpler information consumption.
•  Become less dependent on information technology personnel for generation of reports.

Share

New Product Names within SAP BusinessObjects Version 4.0

The latest version of SAP Business Objects, released in 2011, has been officially named SAP BusinessObjects 4.0 with the title “XI” being removed from the release number. Many of the client tools in the SAP Business Objects application suite will also have a new name in the new version.

Business Objects Application Names for BOBJ XI 3.x vs. BOBJ 4.0

Business Objects (BOBJ) 4.0 - New Application Names

Source: http://bit.ly/gVurCF

Share

BI Market: Operational Reporting (Vendors and Products) – 2011

Operational reports are pre-designed business reports that focus on listings of data at the detailed level with data presented within a highly-structured format. Also known as “canned reports”, operational reports enable organizations to present data in a logical format and are designed to support the day-to-day activities of an organization at the transaction level. They are typically developed by information technology (IT) departments and/or advanced report users that have a good understanding of reporting tools, business rules, and database concepts. In addition, operational reports can be scheduled, refreshed, and distributed on a regular basis. Fundamentally operational reports are used by people with the responsibility for improving their organization’s operations.

In 2011, the market leading vendors for operational reporting include: SAP Business Objects, Oracle, IBM, MicroStrategy, Microsoft, Information Builders (IBI), Pentaho, JasperSoft, Actuate, and LogiXML.

BI Vendor Products - Operational Reporting (2011)


Share

Components of SAP BusinessObjects: Crystal Reports

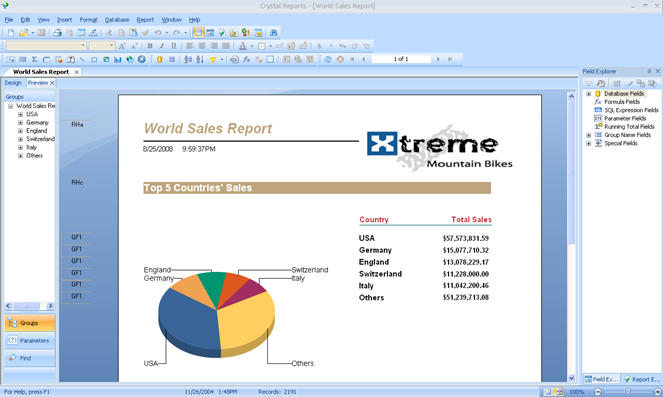
Crystal Reports is an operational reporting environment and component of the SAP BusinessObjects suite of products.  Fundamentally, it is a tool that enables report authors to easily design interactive reports and connect them to virtually any data source. It is the ideal solution for canned or published reports as it allows for the creation of high-fidelity, pixel-perfect reports. Additionally, end-users benefit from on-report sorting and filtering – giving them the power to execute decisions instantly.

More details and graphics of Crystal Reports can be found on the Portfolio Page.

Crystal Reports - Sample Report in Designer Tool

Crystal Reports – Sample Report in Designer Tool

With Crystal Reports, report authors and end-users can leverage an intuitive interface, access data spread across multiple systems, design reports with guided interactivity, and embed reports within both client-server and web applications.  Crystal Reports can be used for report design, application development, and web report delivery.

Read more

Share

Oracle Business Intelligence (BI) Analytical Applications

Rather than just being a platform or development environment, Oracle Business Intelligence (BI) Analytical Applications are fully inclusive business intelligence solutions that incorporate all of the key metrics, workflows, and business processes for a particular business function.  Bundled within theses solutions are numerous pre-built components including:
•  Dashboards
•  Metrics
•  Reports
•  Drill-down paths
•  Dimensional models
•  Naming standards
•  Database objects
•  ETL routines
•  Metadata
•  Security

In addition, Oracle BI Analytical Applications contain universal adapters that allow for rapid integration and direct connections with leading commercial-off-the shelf (COTS) packages including SAP, Oracle E-Business Suite, PeopleSoft, and Siebel applications systems.

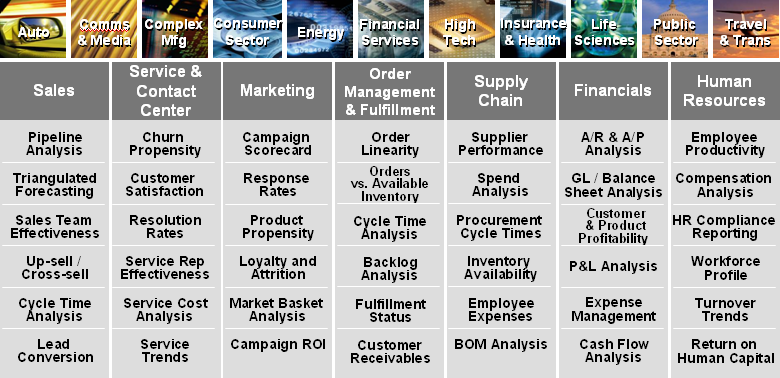
Oracle BI Analytical Applications come bundled with best practices and industry standards built-in. Additionally, they include all of the functionality required to conduct business intelligence for many common business functions including financials, human resources, sales, service, contact centers, marketing, supply chains, order management and fulfillment business areas.

Oracle BI Analytical Application Modules

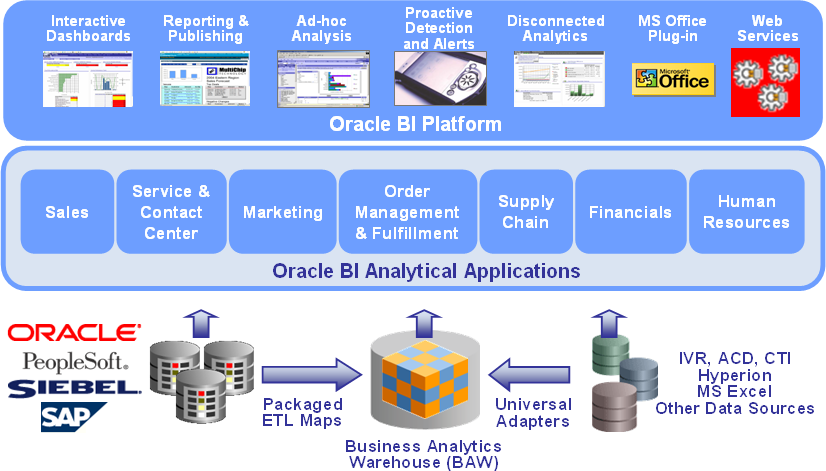
Fundamentally, Oracle BI Analytical Applications are built upon the Oracle BI Platform and provide complete end-to-end, prebuilt business intelligence solutions that deliver intuitive, role-based intelligence to all members of an organization including senior executives, mid-level managers, and front-line employees.  So rather than developing custom business intelligence solutions for each business area and function, the use of Oracle BI Analytical Applications allows an organization the ability to rapidly configure a ready-built solution utilizing the complete Oracle BI Platform.

Oracle BI Platform / Analytical Applications

Oracle BI Analytical Applications come bundled with two main additional pre-built back-end repositories:
•  Business Analytics Warehouse
•  ETL (Extract-Transform-Load) Repository

The Business Analytics Warehouse (BAW) is a completely pre-built data warehouse that physically contains all of necessary dimension and fact table needed for the business intelligence applications. The BAW is fully-compliant with the dimensional modeling methodology developed by Ralph Kimball and supports many advanced techniques including slowly changing dimensions, conformed dimensions, aggregate tables, hierarchy tables, and surrogate keys.

The ETL repository includes all of the routines for extracting of data to a staging area, transforming the data into a common format, the loading of date into data warehouse tables, changed data capture, and seeding data for common dimensions. In addition, the powerful ETL repository consist of two main components, Informatica which is the ETL engine that contains the data integration routines, and the DAC (Data Warehouse Application Console) which is the “ETL orchestration tool” that controls application configuration, execution & recovery, and monitoring.

Share

Data Warehouse Appliance: SAP HANA

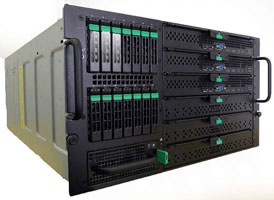
At the Sapphire conference in May, 2010, SAP announced the release of its new data warehouse appliance called HANA or High-Performance Analytic Appliance. SAP HANA is a combination of hardware, storage, operating system, management software, and in-memory data query engine that is characterized by data being held in RAM rather than being read from disks or flash storage. Additionally, HANA has been built to split up queries to run in parallel on multiple processors—a fundamentally different architecture from SAP’s existing applications.  This in-memory and parallel processing architecture of HANA allows for extremely fast performance of queries and analytics on very large amounts of data.

HANA Blade ServerThe SAP HANA solution has been introduced on Hewlett Packard x86 servers (HP ProLiant DL580 G7 and DL980 G7 servers) and is built upon Intel’s multi-core servers. Moreover, a single server blade can contain up to 2TB of main memory (4TB coming soon) and up to 64 processor cores.  With this total solution, SAP claims that they beat the current performance benchmark by factor of 20, on hardware that was several dozens of times cheaper for a 200X price performance improvement. SAP also claims that HANA either reduces or out-right eliminates the need for the development and deployments of complex and expensive datamarts.

SAP intends HANA systems to be well-integrated with its own enterprise resource planning (ERP) systems, allowing for transactional data in SAP ERP systems to be analyzed in real time.  However, HANA is not dependent solely on SAP ERP systems as a data source.  Moreover,  HANA is data source “agnostic”  which means most common data sources and database can be integrated with it.

According to an SAP document, the HANA platform includes a modeling environment that is simple enough for business users to work with.  Additional, HANA supports client interfaces currently include Microsoft Excel and SAP’s Business Objects business intelligence software.

References: SAP’s Transformation: A Work-In-Progress – Part One (ChainLink Research)SAP Launches HANA for In-memory Analytics (PC World)

Share

Components of SAP BusinessObjects: Xcelsius

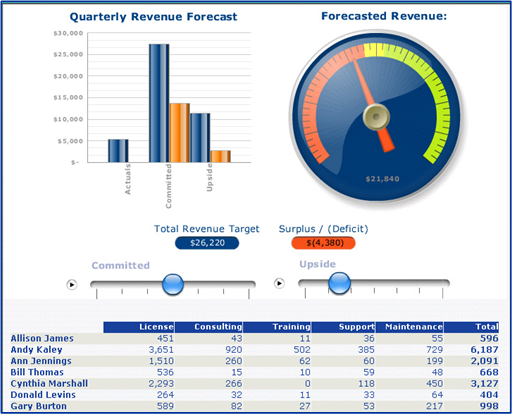
Xcelsius is the primary dashboard development tool of the SAP BusinessObjects suite of business intelligence products.  Xcelsius extends the power of business intelligence environments by offering interactive devices including gauges, charts, widgets, drop-down menus, and sliders.  These intuitive and user-friendly devices simplify the display of complex business data and provide decision makers with an easy way to interact with data and test out future business scenarios with the click of a mouse.

Sample Xcelsius Dashboard

Sample Xcelsius Dashboard

At its heart, Xcelsius is a dynamic and customizable data visualization software package that enables development of both insightful and engaging dashboards from various data sources throughout a typical organization. Moreover, Xcelsius includes graphical interfaces and real-time methods that provide guided analysis and for dynamic monitoring of organizational metrics and key performance indicators (KPIs).

Key Features of Xcelsius Dashboards Include:

•  Intuitive graphical visualizations of data.
•  Dashboard customization to meet unique business needs.
•  Connection of dashboards to any type of data source.
•  Maximization of the value of a business intelligence solution with rich user interface.
•  Deployment of dashboards within Microsoft Office, Adobe PDF, Portals, or on the Web.
•  Empowerment of decision-makers to view and understand key organizational metrics.
•  Improved user adoption of BI tools because of business-friendly visualizations.
Share

ASUG North Carolina – Virginia Chapter Meeting (Friday, 3/25/2011)

Register today and plan to attend the ASUG North Carolina – Virginia Chapter Meeting on Friday, March 25, 2011.  Don’t miss your chance to learn from the real experience of ASUG members in your area at this educational and networking event. Registration is now open and is included as part of your ASUG member benefits.

Register Now

Date: Friday, March 25, 2011
Time: 8:30 a.m. – 3:30 p.m. ET
Location: Terremark
18155 Technology Drive
Culpepper, VA 22701

Presentations Include:
• Enabling SAP in the Cloud (Carle LaFoe – Protera, Jim Anthony – Terremark)
• Operating SAP Systems in Virtual and Cloud Environments: Vision and Next Steps (Jeff Anders – SAP Labs)
• Managing a Business Intelligence Center of Excellence (COE) with SAP Business Objects (Adam Getz – Amtrak)
• Data Center Tour (Terremark)
• If they use it, it will pay for itself! How effective User Adoption Can Lead To Success (Tom Fallwell – DMG Federal, Mark Anderson – Sentara Healthcare)
• Adopting SAP’S FSCM-Dispute Management (Hari Subrahmanyan – World Kitchen LLC)
• From Business Data to Business Intelligence at Volkswagen: Leveraging data using Business Objects (Tom Danieli – Volkswagen of America)
Share

SAP BusinessObjects 4.0 E-Learning Catalog

SAP is now offering official product tutorials to assist in learning the latest SAP BusinessObjects 4.0 suite of products. Each product page acts as a dynamic library of material where content is added as it is created. Below is the list of products with available interactive and animated tutorials online. For more information on what’s available, please click here.

•  SAP Crystal Reports 2011
•  SAP Crystal Reports for Enterprise
•  SAP BusinessObjects Dashboards
•  SAP BusinessObjects Web Intelligence
•  SAP BusinessObjects Explorer
•  SAP BusinessObjects Information Design Tool
•  SAP BusinessObjects Business Intelligence Platform
•  SAP BusinessObjects Analysis (coming in Q1-2011)

Resources: SAP BI Suite ELearning Catalog

Source: http://www.pieterhendrikx.com/category/sapbo/page/3/

Share

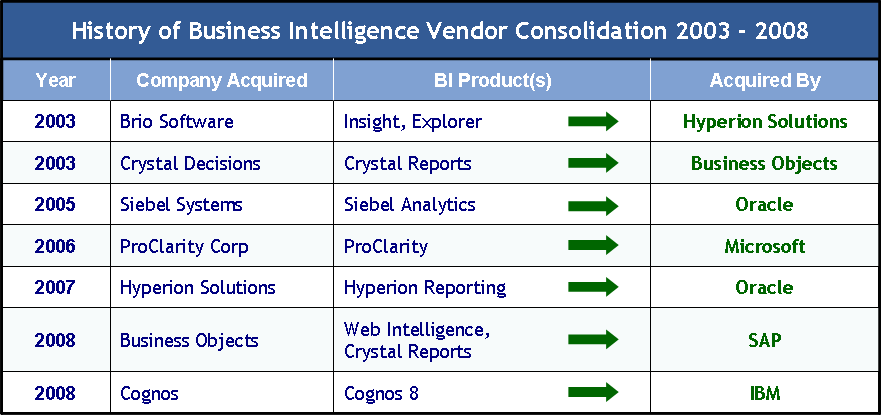
Business Intelligence Vendor Consolidation (2003-2008)

The business intelligence (BI) software marketplace has seen a wave of corporate acquisitions since the mid 1990s with the size and importance of the acquisitions coming to their apex during the years 2003 – 2008. This surge in corporate activity in the mid part of the decade has been characterized by a number of large software companies making major, strategic moves.   Thus the industry is now in a state in which there are clear leaders or as Gartner, Inc puts it, “megavendors” that own a significant control over the over-all market share. In addition the rest of the BI vendors that not have been a part of acquisition activity are smaller organizations and are more commonly referred to as “niche” or “pure-play” vendors.  These “niche” vendors each produce and sell viable business intelligence software products, but they do not encompass the breadth of complimentary technologies that the “megavendor” produces.

Business Intelligence Vendor Consolidation (2003-2008)

BI Vendor Consolidation (2003-2008)

As a result of the BI vendor consolidation of 2003-2008 the following megavendors have placed themselves in a position to control over 2/3 of the business intelligence software marketplace …
•   IBM
•   Microsoft
•   Oracle
•   SAP Business Objects
Share