Business Intelligence Capability – Data Visualization

Overview of Data Visualization Solutions

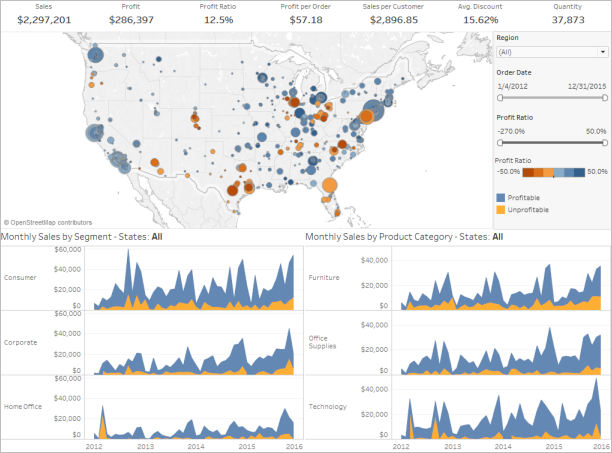
Data Visualization Solutions enable analysis by providing highly-graphical representations of information and data. By using visual elements including charts, graphs, and maps, data visualization is an accessible way to see and understand trends, outliers, and patterns in data. Further, data visualization refers to the techniques used to communicate data or information by encoding it as visual objects contained within graphics.

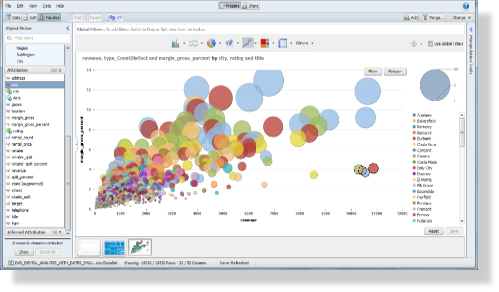
Data visualization tools go beyond the display of basic charts and graphs. Moreover, they display data in more sophisticated ways such as geographic maps, infographics, dials, gauges, sparklines, heat maps, networks, graphs, and charts. The images may include interactive capabilities, enabling users to manipulate them or drill into the data for querying and analysis.  Additionally, numerical data may be encoded within graphics using dots, lines, circles, bubbles, or bars, to visually communicate a quantitative message. Indicators designed to alert users when data has been updated or predefined conditions occur can also be included.  Because of the way the human brain processes information, using graphics to visualize large amounts of data is for more effective for rapid analysis then just looking at data within queries and reports.  Effective data visualization assists users to analyze and reason about data and to draw conclusions. These types of analytical tools make complex data sets more intuitive, understandable, and usable for decision-making.


Characteristics of Data Visualization Solutions

•  Highly graphical presentation of data.
•  Intuitive user interface with visual presentation of data.
•  Rapid comprehension of data.
•  Comparison of different pieces of data.
•  Ease of interpretation of data.
•  Quantitative evaluation of data.
•  Presents numerous numerical metrics in a relatively small space.
•  Numerical data encoded within graphics using dots, lines, circles, bubbles, or bars.
•  Reveals data at several levels of detail and perspectives.
•  Indication of data relationships, patterns, and outliers.
•  Makes large data sets coherent.
•  Enables analysis of trends.
•  Identification of data indicators.
•  Conversion of data into information.

Share

Business Intelligence Capability – Data Exploration

Overview of Data Exploration Solutions

Data Exploration Solutions enable robust visual searches of vast amounts of data and are commonly used by data analysts.

Data Exploration Solutions include sophisticated data discovery capabilities that enable users to rapidly and intuitively search through large amounts of data in order to gain insights.  Subsequently data exploration solutions enable users to quickly retrieve answers about organizational data and enable users to quickly generate information about the data.  In addition data exploration solutions provide informative search capabilities in order to enable analysis of the available data and enable conversion of the data into information.  While data exploration solutions do enable queries of data, the data is exposed to users using business terminology and underlying database structures and data models are hidden to the user.

SAP BusinessObjects Explorer

Characteristics of Data Exploration Solutions

•  Rapid searches of large data sets
•  Sophisticated data discovery capabilities
•  Intuitive user interface with keyword searches
•  Filtering of data from multiple dimensions or perspectives
•  Drill-down, drill-up capabilities
•  Visualization of data in multiple formats
•  Integration with central databases and data warehouses
•  Guided discovery of data with contextual navigation
•  Abstraction of underlying database and data models
•  Conversion of data into information
Share

Column and Row Based Database Storage

TableRowColumnStore_320x9999
Row-Based Database Storage:
The data sequence consists of the data fields in one table row.
Column-Based Database Storage:
The data sequence consists of the entries in one table column.

Conceptually, a database table is a two-dimensional data structure with cells organized in rows and columns. However, computer memory is organized as a linear sequence. For storing a database table in linear memory, two options can be chosen (row based storage or column based storage). Row based storage stores a sequence of records that contain the fields of one row in the table. In column based storage, the entries of a column are stored in contiguous memory locations.

Row-based database systems are designed to efficiently return data for an entire row, or record, in as few operations as possible. This matches the common use-case where the system is attempting to retrieve information about a particular object. This is particularly useful for transactional systems that conduct large amounts of inserts, updates, and deletes of records.

Column-based database systems combine all of the values of a column together, then the values of the next column, and so on. Within this layout, any one of the columns more closely matches the structure of an index in a row-based system. The goal of a columnar database is to efficiently write and read data to and from hard disk storage in order to speed  up performance of select queries. This is particularly useful for systems that conduct large amounts of analytics.

Column-oriented-database

Row-based storage is recommended for transactional systems or when:

•  The table has a small number of rows, such as configuration tables.
•  The application needs to conducts updates of single records.
•  The application typically needs to access the complete record.
•  The columns contain mainly distinct values so the compression rate would be low.
•  Aggregations and fast searching are not required.

Column-based storage is recommended for analytical systems or when:

•  Calculations are executed on a single column or a few columns only.
•  The table is searched based on the values of a few columns.
•  The table has a large number of columns.
•  The table has a large number of records.
•  Aggregations and fast searching on large tables are required.
•  Columns contain only a few distinct values, resulting in higher compression rates.
Share

Balanced Scorecard Defined

Balanced Scorecard is a performance management tool used by executives and managers to manage the execution of organizational activities and to monitor the results of actions.  Fundamentally a balanced scorecard provides a summary level view of organizational performance at a quick glance and includes key performance indicators (KPIs) across four main areas or perspectives:

Financial Perspective:  KPIs for productivity, revenue, growth, usage, and overall shareholder value.
Customer Perspective: KPIs for customer acquisition, customer satisfaction rates, market share, and overall brand strength.
Internal Process Perspective:  KPIs for resource usage, inventory turnover rates, order fulfillment, and quality control.
Learning / Growth Perspective:  KPIs for employee retention, employee satisfaction, and employee education, training, and development.

Balanced Scorecard - Four Perspectives

Balanced Scorecard – Four Perspectives

The balanced scorecard concept was originated by Drs. Robert Kaplan (Harvard Business School) and David Norton as a framework for managing and measurement organizational performance.  The concept added strategic non-financial performance measures to traditional financial metrics to provide executives and managers a more ‘balanced’ and ‘holistic’ view of organizational performance.  Over time the balanced scorecard has evolved from its early use as a simple performance measurement tool to a complete strategic planning and management system. The latest version of the balanced scorecard transforms an organization’s strategic plan from a passive document into the active actions the organization needs to perform on a daily basis. Additionally, it provides a framework that not only provides performance measurements, but helps planners identify what should be performed and what should be measured.

Adapted from Microsoft Technet and Balanced Scorecard Institite.

Share

Crystal Reports 2011 / Crystal Reports for Enterprise

With the release of SAP Business Objects 4.0 in 2011, there now exist two distinct current versions of Crystal Reports (Crystal Reports 2011 and Crystal Reports for Enterprise).  In building the latest release of Crystal Reports, the goal was to create an enhanced developer interface and the best possible connectivity with the new semantic / universe layer in SAP Business Objects 4.0.  But the new release needed to also have zero disruption in the use of legacy and existing Crystal Reports.  Subsequently, SAP Business Objects has released a new version of the product that is similar to the existing product (i.e. Crystal Reports 2011) and a next-generation product that has a completely been redeveloped and includes a new user interface and new underlying architecture (i.e. Crystal Reports for Enterprise).

Crystal Reports 2011
•  Incremental update to CR 2008 with a few new features
•  Focused on serving the needs of legacy customers
•  Delivers existing functionality with no regressions
•  Seamless upgrades from legacy releases of Crystal Reports
Crystal Reports for Enterprise
•  Major update & re-design of the Crystal Reports Designer
•  Connectivity with new unx universe / semantic layer
•  Enhanced report design tool (smart formatting)
•  Many new features and functions
•  Some regression of functionality
•  Limitation to universe as a data source
SAP Business Objects has determined the Crystal Reports for Enterprise is the future of the Crystal Reports product line and subsequently it provides the foundation for all future releases of Crystal Reports.  To this end, there are a number of completely new features in Crystal Reports for Enterprise including:
•  Smart Formatting of Reports
•  Streamlined Tab Control User Interface
•  New Charting Engine
•  New Multilingual Support
•  New Alerting Mechanism
•  Enhanced Connectivity with Universes
•  Enhanced Connectivity with SAP BW

Of the many features in Crystal Reports for Enterprise, there exists one that will fundamentally change how developers interact with reports. This new feature is called Smart Formatting and it will greatly enhance report developer efficiency.  With smart formatting, the Crystal Reports Designer automatically detects patterns in report formatting. And upon changes to the report, the designer will rapidly adjust the design of the report.

Crystal Reports for Enterprise - Smart Formatting

Crystal Reports for Enterprise – Smart Formatting

Features of Smart Formatting in Crystal Reports for Enterprise include:
•  Automatic Resizing Of Colum Upon Object And Column Insertion
•  Automatic Column Shifting Upon Object And Column Insertion
•  Guidelines For Easy Column Resizing
•  Ability To Drag And Drop To Reorder Columns
There are also number of features that have not been incorporated within the initial release of Crystal Reports for Enterprise.  These regressed features that are not included in Crystal Reports for Enterprise v4.0 include:
•  No Native Connections to Database
•  No Support for Database Connectivity (ODBC, JDBC)
•  No Support for OLAP as a Data Source (except BEx Queries)
•  No Support for Live Office
•  No Support for Enterprise Search
•  Gaps within API and SDK
Share

Operational BI vs Strategic BI

Operational Business Intelligence

Operational business intelligence is often associated with reporting from a transactional or operational data source, and typically is consistent with reporting of data within or during an organizational business process. Further, operational business intelligence can be defined as analytics that is tightly connected or embedded within common business processes with the twin goals of supporting operational decision making and monitoring organizational operations.

Operational Business Intelligence

In general, operational business intelligence provides time-sensitive, relevant information to operations managers, business professionals, and front-line, customer-facing employees to support daily work processes. Additionally if the data retrieved from the analysis directly supports or helps complete an operational tasks, then the intelligence is operational in nature.

Tangible results of operational business intelligence can include:
•  Invoices
•  Meeting Schedules and Badges
•  Receipts
•  Shipping Documents
•  Financial Statements
•  Marketing Mailing Lists

Strategic Business Intelligence

Strategic business intelligence is often associated with reporting from an analytical data source, data mart, or data warehouse. Fundamentally, strategic business intelligence improves a business process by analyzing a predetermined set of metrics relevant to that process and provides historical context of data.  In addition, strategic intelligence provides the basis for forecasting, goal-setting, and strategic planning and direction.

Strategic Business IntelligenceThe focus of strategic business intelligence is on (1) collection, organization and storage of huge amounts of data, (2) optimization of that data for rapid reporting and analysis, (3) and identification of key business drivers through the analysis of historical facts, (4) assistance with answering key business questions.

Questions answered by strategic business intelligence can include:
•  Who are the most valuable customers?
•  Which customers are most likely to buy additional products / services?
•  Which products can be bundled together?
•  Which territories or regions have the highest project growth?
•  What is the optimal price of our products?
•  What is the total cost associated with customer acquisition?
Share

Business Objects Live Office

Live Office from SAP Business Objects integrates business intelligence functionality from the Business Objects suite within the commonly-used Microsoft Office environment. Subsequently Live Office enables users are able to embed refreshable information within documents, spreadsheets, and presentations and share them across their organization. Live Office provides users with real-time data that is verifiable and easily refreshed. As Live Office is built directly into Microsoft Office applications, needed information is available at the user’s finger tips and is available in a familiar, easy to use format. In a nutshell, Live Office empowers business users to easily access corporate data from within Microsoft Office Excel, Word, Outlook, and PowerPoint without depending on expertise from the information technology department.

Live Office PowerPoint Sample

Benefits of Business Objects Live Office
•  Access business intelligence (BI) content directly within Microsoft Office.
•  Embed business intelligence directly in your e-mail messages using Microsoft Outlook.
•  Format and perform calculations using familiar features of Excel, PowerPoint, and Word.
•  Increase business user autonomy by exposing corporate data in Microsoft Office documents, spreadsheets, and presentations rather than web applications.
•  Improve timelines of decisions by enabling simpler information consumption.
•  Become less dependent on information technology personnel for generation of reports.

Share

Operational, Tactical, & Strategic Dashboards

Xcelsius DashboardAs your organization seeks to better understand its customer and manage a diverse line of services and products, operational, tactical and strategic dashboards should become a critical addition to your planning and decision-making toolbox. Whether the dashboard provides your Executive Director a 30,000-foot view of the organization as a whole, or the product line manager an interactive interface which allows exploration into the details of a particular product’s performance, your organization can benefit a well-built dashboard.

Achieving accuracy and consistency for all dashboards within an organization can be both a challenging and expensive task. To this end, TMA Resources delivers three categories of dashboards to its customers to ensure that the right type of presentation is delivered to your organization’s decision–makers …

• Operational Dashboards: Continuously monitor core business processes with real-time transactional data. Alert your managers upon thresholds being exceeded or upon an exception in the data.

• Tactical Dashboards: Provide the department manager with a quick view into how his or her department is performing and highlight areas of concern—so the manager can take action to forestall less-than-optimal performance.

• Strategic Dashboards: Provide senior managers and executives with a glance of the organization’s performance in relation to strategic goals. These dashboards are typically based upon data residing in one of the organizations data warehouses or data marts and contain time-stamped snapshots of data.

Share

Key Benefits of a Data Warehouse

Cool Data Warehouse

Data Warehouses are centralized data repositories that integrate data from various transactional, legacy, or external systems, applications, and sources. The data warehouse provides an environment separate from the operational systems and is completely designed for decision-support, analytical-reporting, ad-hoc queries, and data mining. This isolation and optimization enables queries to be performed without any impact on the systems that support the business’ primary transactions (i.e transactional and operational systems). Read more

Share

BI Market: Data Mining & Predictive Analytics (Vendors and Products) – 2011

Data Mining & Predictive Analytic solutions provide the capabilities of analyzing large data sets in order to find patterns that can help to isolate key variables to build predictive models for management decision making.  In addition, data mining applications help discover hidden patterns and relationships in data in order to effectively project and predict future results. In order to accomplish this goal, data mining application utilize statistics, algorithms, advanced mathematical techniques, and sophisticated data search capabilities.  Moreover, these sophisticated tools provide answers to questions that may never have been asked and they are effectively able to determine relative amounts of correlation between data elements. Further, the predictive features of these data mining tools enable organizations to exploit useful patterns in data that may have otherwise been difficult to determine.

In 2011, the market leading vendors for data mining systems include: IBM SPSS, SAS, SAP Business Objects, Oracle, MicroStrategy, ThinkAnalytics, Pentaho, & Angoss.

BI Vendor Products - Data Mining (2011)

Share