What is a SAFe Product Owner?
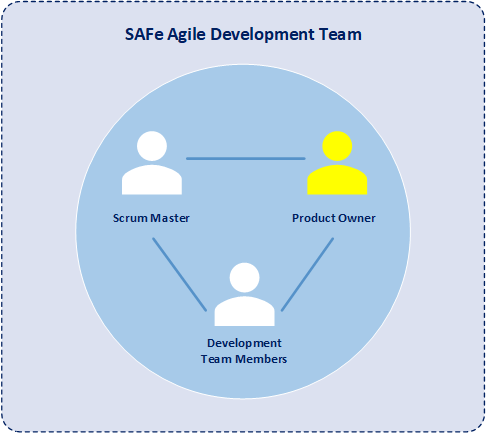
The SAFe Product Owner is a member of the Agile development team who works as the voice of the customer.
SAFe Product Owner Defined
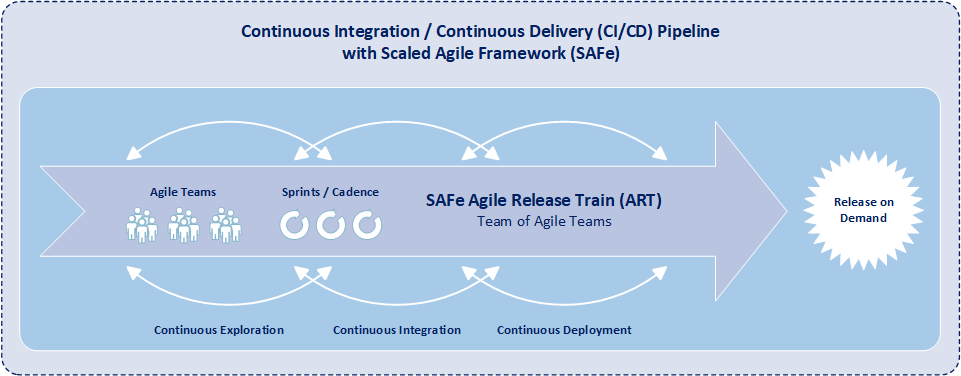
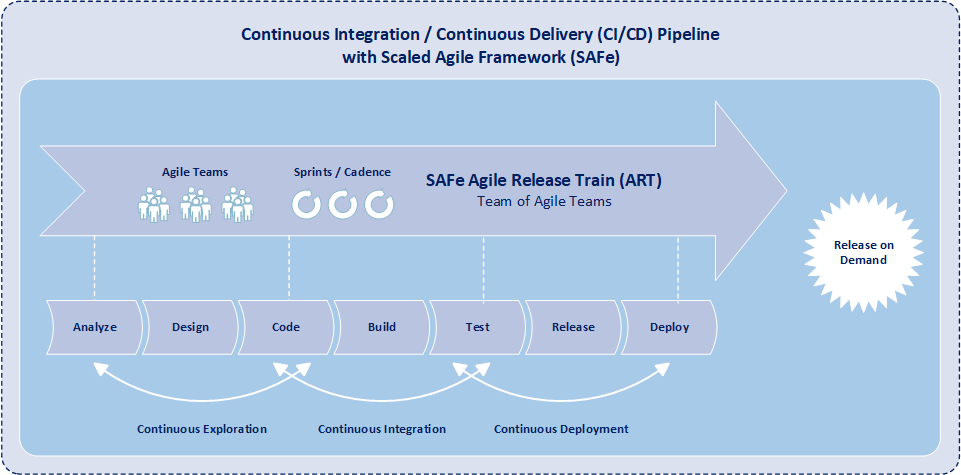
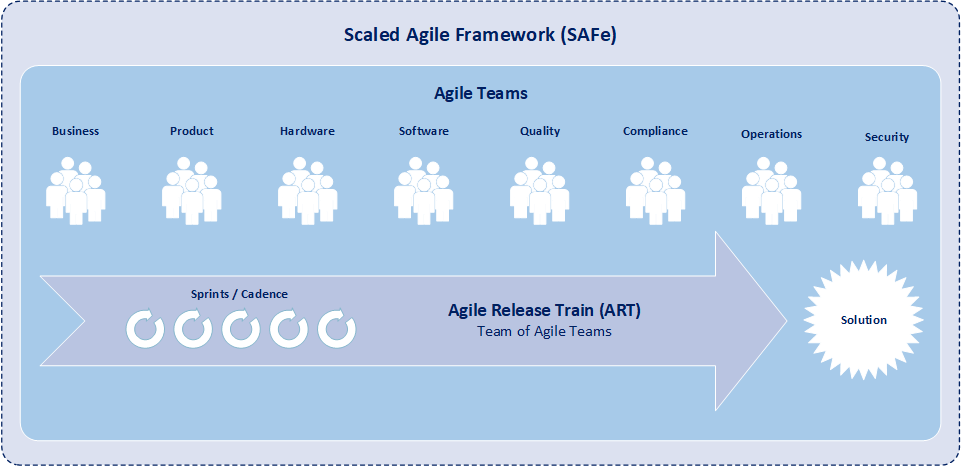
Scaled Agile Framework (SAFe) extends the core concepts of traditional Agile systems development and is designed to be used for an entire organization. Additionally, SAFe is the most commonly utilized approach for scaling and common management of Agile implementation practices that are implemented at the organization, enterprise, or portfolio level. SAFe is a body of knowledge that provides guidance on roles and responsibilities, details on planning and managing development programs, and values to uphold during all stages of development.
One of the key roles within SAFe is the product owner (PO). The product owner is a member of an individual development team, is responsible for defining stories, for prioritizing the team backlog of features, and for communications with products from other development teams. Further, the product owner plays a vital role in serving as the voice of the customer, maximizing the value of the solution, and focusing the efforts of the Agile development team. Moreover, the product owner checks and coordinates dependencies across development teams in order best to improve agile release train (ART) development processes while increasing both the development team velocity and the quality of solutions.
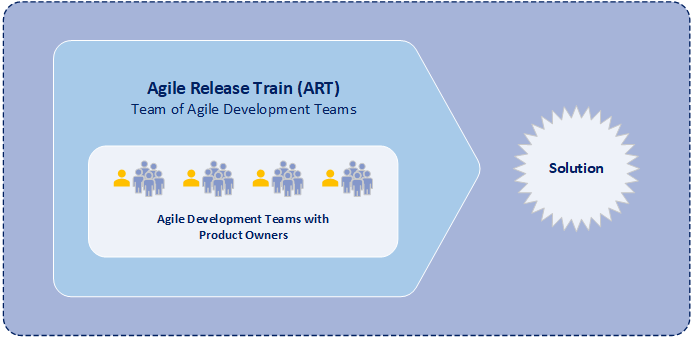
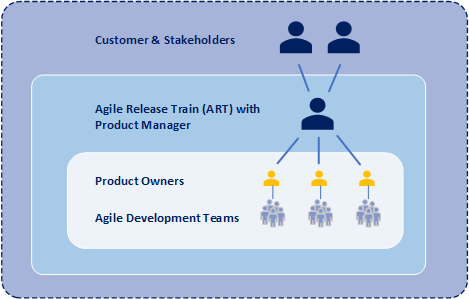
While the product owner serves as the voice of the customer to the agile development team, the product owner is not the only one that communicates with the customer and stakeholders. Another key role in SAFe is product management. Moreover product management is the primary interface with the customer and stakeholders within an agile release train. And product management coordinates system and functional requirements among the various product owners within the same agile release train. Typically an agile release train consists of one product manager and four-to-six product owners. Product management focuses on understanding a solution at program level while product owners focus on understanding individual components of a solution.
Responsibilities of a SAFe Product Owner
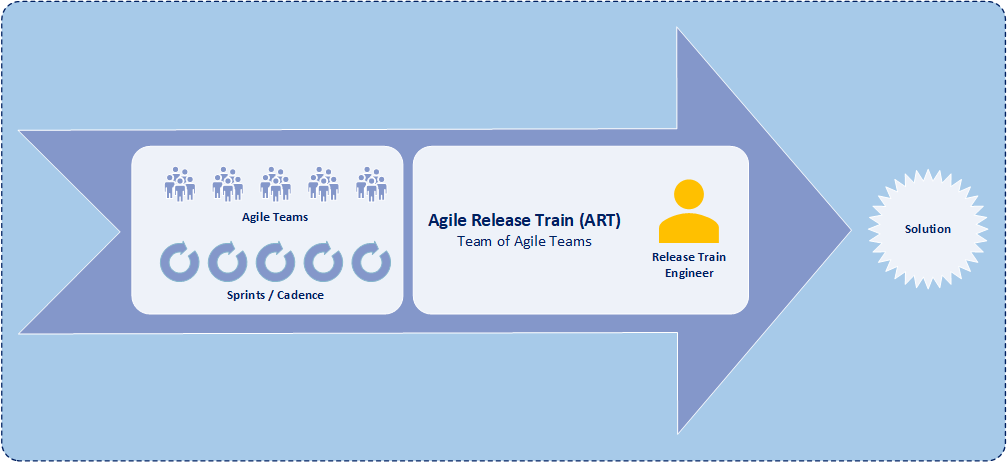
SAFe product owners are responsible for maintaining and prioritizing features with the development team backlog, conducting iteration planning, decomposing features into stories, determining acceptance criteria for stories, and accepting completion of stories. Additionally product owners coordinate dependencies with other product owners and provide development team status to the product manager of the agile release train (ART). And an agile release train is component of a program that includes multiple development teams working on similar features.
The product owner plays a role that is at the core of SAFe. Subsequently, the product owner is responsible for setting up the product strategy, understanding and communicating customer requirements, and prioritizing the features in the development team backlog. Further, product owners have the responsibility of ensuring customer requirements are satisfied and ensuring value of the developed solution.
The SAFe Product Owner has responsibilities in each of the following SAFe Events:
– Program Increment Planning
A program increment (PI) within SAFe is a timebox during which a development team delivers incremental value in the form of working software and systems. Subsequently a PI typically lasts 8-12 weeks and commonly includes 4-6 iterations. Product owners are heavily involved in program backlog refinement of epics and preparation for each PI planning event. Prior to the PI planning event, the product owner updates the development team backlog, contributes to creating a program vision, and assists with charting out a program roadmap. During the PI planning event, the product owner assist the development team with story definition, provides necessary clarifications for story creation, and provides upcoming PI objectives.
– Iteration Execution
Iterations are the basic building blocks of development within SAFe. Each iteration is a standard, fixed-length timebox, where development teams create incremental value in the form of working software and systems. Within SAFe, multiple time-boxed iterations occur within a program increment, and iterations are commonly one or two weeks in length. Additionally, iteration execution is how development teams manage their work throughout the duration of an iteration.
During iteration execution, the SAFe product owner is responsible for:
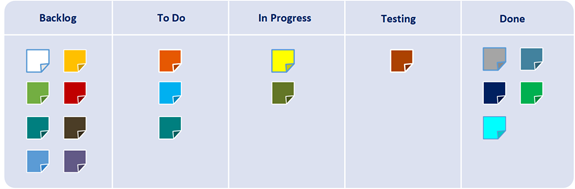
• Creating, updating, and maintaining the development team backlog with stories.
• Prioritizing and ordering the stories with in the development team backlog.
• Planning for each iteration.
• Providing development team members clarity and details of stories.
• Reviewing stories for completion.
• Accepting stories as complete per the definition of done.
• Coordinating and syncing with other product owners of other development teams.
• Providing the customer’s perspective to the development team.
• Participating in the development team demonstration and team retrospective.
– Product Owner Sync
Continuously during each program increment, the product owner communicates and synchronizes direction with other product owners assigned to other teams within the same agile release train. Typically the product owners of a agile release train meet once a week for 30 – 60 minutes to check and coordinate dependencies with each other. The purpose of the product owner sync is to get visibility into how well the development teams within an agile release train are progressing toward meeting program increment objectives, to discuss problems or opportunities within the agile release train, to assess any scope adjustments, and determine additional features. The product owner sync event may also be used to prepare for the next program increment, and may include both program backlog refinement and program backlog prioritization.
– Inspection and Adaptation Workshop
The inspect and adapt (I&A) workshop is a significant event is commonly held at the end of each program increment, is used to address any large impediments, and is used to smooth out progress throughout an agile release train. During the workshop, the current state of a solution is demonstrated and evaluated by the members of the agile release train including product owners. Moreover during this workshop, product owners work across development teams to see how best to improve processes, increase development team velocity, and improve solution quality. During the workshop, the product owners conduct system demonstrations for program stakeholders and elicit feedback from the stakeholders. This stakeholder feedback is then used to determine features for the program backlog.