Components of Oracle BI Enterprise Edition (OBIEE) – Oracle Delivers

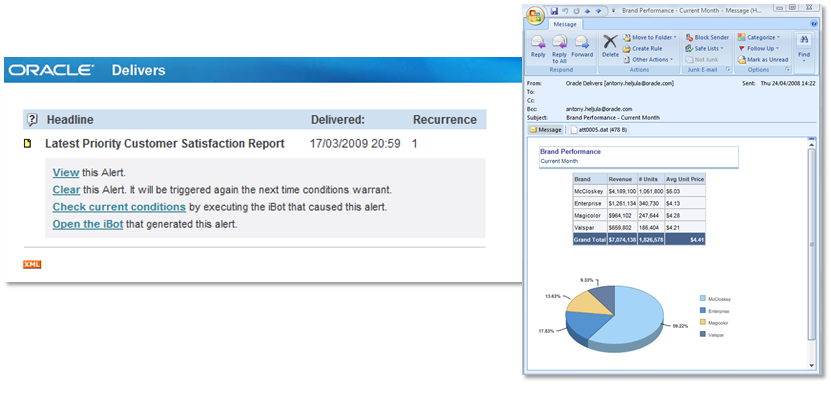
Oracle Delivers is a component of the Oracle Business Intelligence Enterprise Edition suite that provides activity monitoring and alerting that can reach users via multiple channels such as:

•  Email
•  Dashboards
•  Mobile devices

Oracle Delivers includes a web-based self-service alert creation and subscription portal, and a workflow engine that allows for initiation and passing of contextual information to other alerts. Furthermore, it can dynamically determine recipients and personalized content to reach the right users at the right time with the right information.

Oracle BI Delivers

In a nutshell, Oracle Delivers notifies business users with relevant reports and data when events occur. Notifications can be sent and received utilizing most common communication channels.

Components of Oracle BI Enterprise Edition (OBIEE) – Oracle Publisher

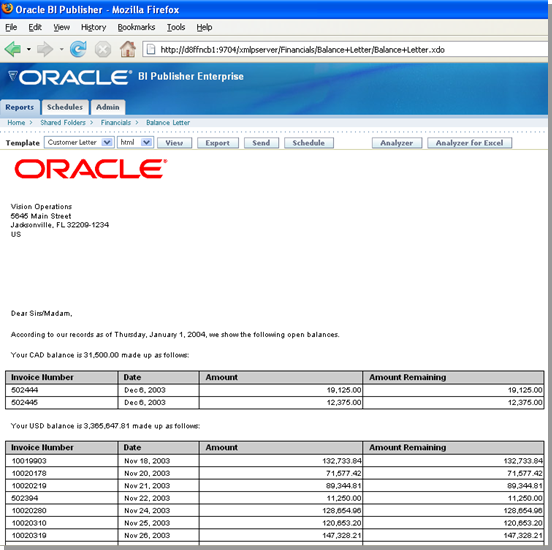
Oracle Publisher (formerly XML Publisher) is a component of the Oracle Business Intelligence Enterprise Edition suite is an enterprise-level operational reporting tool that separates the data from the presentation. This means that developers from the information technology department can define the data sources, and business users can specify the report layout. The same data source can be used by multiple report templates.  By separating the task of finding the data from the task of deciding how to present them, the business user can define a report template with exactly the format he or she wishes.

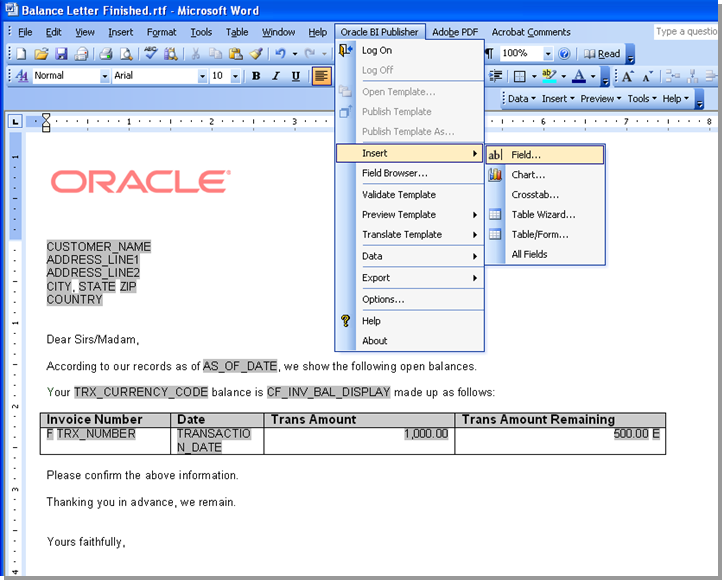
Oracle BI Publisher

Rather then having an independent report design environment, Oracle Publisher leverages both MS Word and Adobe Acrobat as a user interface for the creation of richly-formatted operational reports.

Oracle BI Publisher

Components of Oracle BI Enterprise Edition (OBIEE) – Oracle Answers

Oracle Answers is a component of the Oracle Business Intelligence Enterprise Edition suite that provides ad-hoc query and analysis capabilities to end-users.  Users can processes data from multiple data sources in a pure web environment. In addition, users are isolated from underlying data structures as they view and work with a logical view of the information.  This logical view of the information is presented to the user in business terms.  The interface of Oracle Answers is highly-intuitive and enables end-users to create:
• Queries
• Data tables
• Interactive charts and graphs
• Pivot tables
• Reports
• Prompts

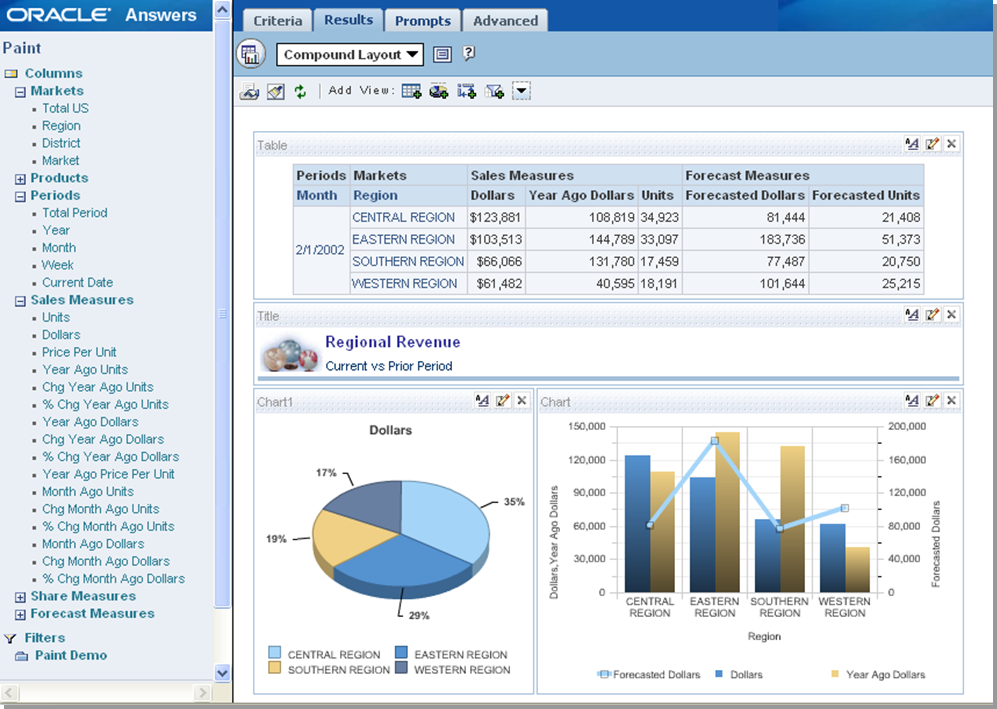
Oracle Answers provides a point-and-click interface that allows end-user to develop robust ad-hoc queries and reports. Users simply drag-n-drop fields to create layouts with reports, queries, and charts on the right-hand side of the application.  Data fields are subsequently on listed on the left-hand side.

Oracle BI Answers

In addition, Oracle Answers is tightly integrated Oracle Interactive Dashboards. Reports, prompts, tables, charts, & graphs created in Oracle Answers can be easily saved, shared, modified, formatted, or integrated within dashboards of the Oracle Interactive Dashboards application.

Components of Oracle BI Enterprise Edition (OBIEE) – Oracle Interactive Dashboards

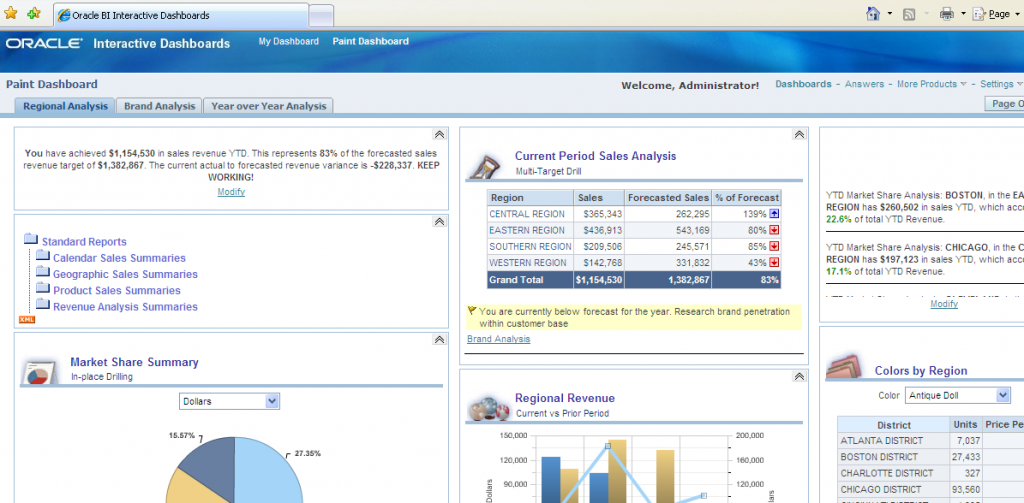
Oracle Interactive Dashboards is a presentation component of the Oracle Business Intelligence Enterprise Edition (OBIEE) suite and provides versatile, web-based dashboards that displays information in a highly-intuitive format to help end-users’ decision making.  The user interface is completely graphical while access to the information is interactive and based on the individual’s role and identity. Further, the user has full capability for modifying and interacting with data utilizing the following controls …
• Live reports
• Charts
• Tables
• Prompts
• Pivot tables

Additionally, the Oracle Interactive Dashboards provides the user with full capability of drilling, navigating, modifying, and interacting with data sets. This concept is commonly referred to as “guided analysis“.  Oracle Interactive Dashboards can retrieve and aggregate content from a wide variety of sources, including the traditional databases, data warehouses and data marts, shared file servers, and document repositories.

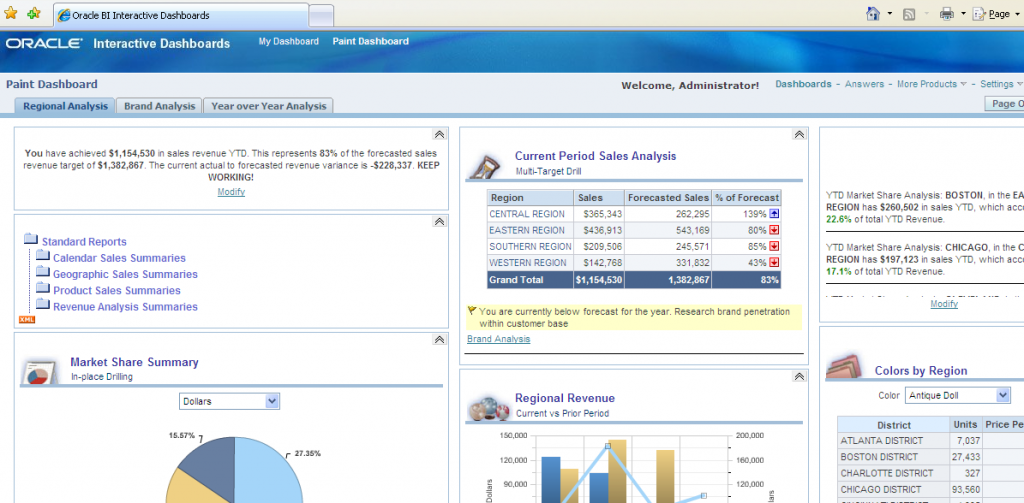
OracleBI - Dashboards

Oracle Interactive Dashboards provide personalized views of corporate and external information. A dashboard consists of one or more pages, which appear as tabs across the top of the dashboard. Pages can display anything that you can access or open with your Web browser, such as saved queries and requests, alerts from Oracle Delivers, images, charts, tables, text, and links to Web sites and documents.

Differences in Oracle BI (Platform vs. Analytical Applications)

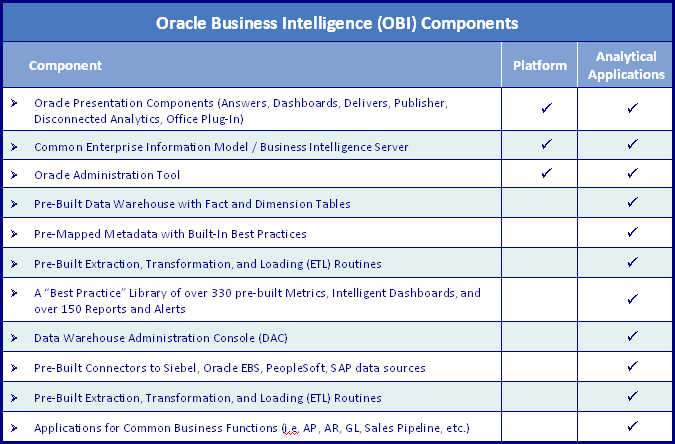
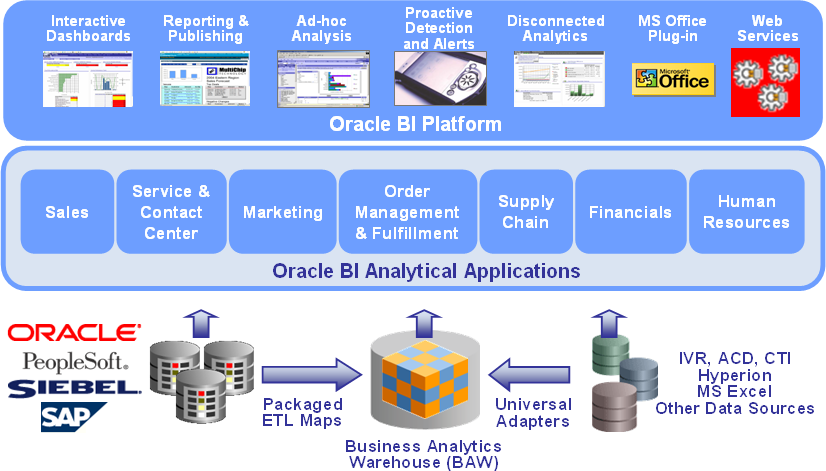
A key way to understand the differences between the Oracle BI Platform and Oracle BI Analytical Applications is to identify that the platform contains the environment and tools for custom building business intelligence solutions, while the analytical applications contain complete, pre-built solutions that can be rapidly configured. Oracle BI Analytical Applications utilize all of the tools within the Oracle BI Platform as well as several additional tools, and all of the components of the Oracle BI Platform are bundled within Oracle BI Analytical Applications. Moreover, within the Analytical Applications, Oracle has leveraged its experience in providing industry-specific business solutions to deliver comprehensive and fully-inclusive business intelligence solutions for numerous common business functions.

Oracle BI Platform / Analytical Applications Components

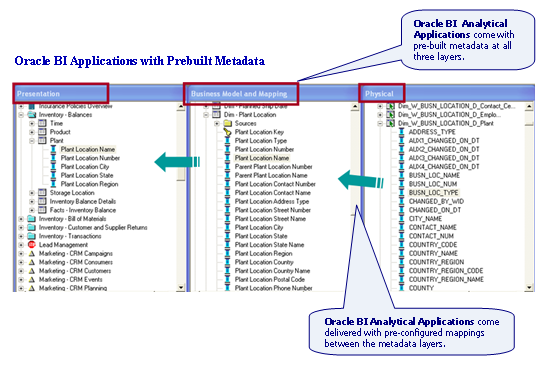
Another important concept in the differentiation of the Oracle BI Platform and Oracle BI Analytical Applications is the amount of content delivered in the metadata or middleware layer. In a nutshell, the metadata layer within Oracle BI creates a semantic model over an organization’s entire data set, consists of the information that characterizes data, and describes how the organizational data should be presented by the user interface of the business intelligence environment.

The Oracle BI Platform is delivered without any pre-existing metadata as it only contains the tools for developing metadata.

Oracle BI Platform Metadata

However, Oracle BI Analytical Applications come delivered with a rich set of metadata elements at all three layers (physical, logical, and presentation) and come delivered with the mappings between the levels already being developed and configured as well as physical connections already being defined.

Oracle BI Analytical Applications Metadata

Oracle Business Intelligence (BI) Analytical Applications

Rather than just being a platform or development environment, Oracle Business Intelligence (BI) Analytical Applications are fully inclusive business intelligence solutions that incorporate all of the key metrics, workflows, and business processes for a particular business function.  Bundled within theses solutions are numerous pre-built components including:
•  Dashboards
•  Metrics
•  Reports
•  Drill-down paths
•  Dimensional models
•  Naming standards
•  Database objects
•  ETL routines
•  Metadata
•  Security

In addition, Oracle BI Analytical Applications contain universal adapters that allow for rapid integration and direct connections with leading commercial-off-the shelf (COTS) packages including SAP, Oracle E-Business Suite, PeopleSoft, and Siebel applications systems.

Oracle BI Analytical Applications come bundled with best practices and industry standards built-in. Additionally, they include all of the functionality required to conduct business intelligence for many common business functions including financials, human resources, sales, service, contact centers, marketing, supply chains, order management and fulfillment business areas.
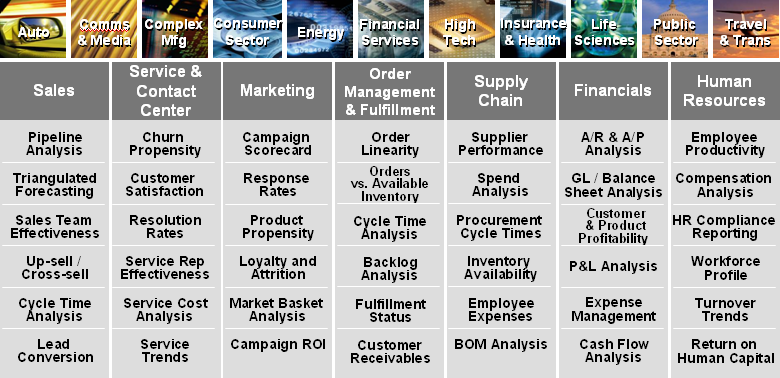
Oracle BI Analytical Application Modules

Fundamentally, Oracle BI Analytical Applications are built upon the Oracle BI Platform and provide complete end-to-end, prebuilt business intelligence solutions that deliver intuitive, role-based intelligence to all members of an organization including senior executives, mid-level managers, and front-line employees.  So rather than developing custom business intelligence solutions for each business area and function, the use of Oracle BI Analytical Applications allows an organization the ability to rapidly configure a ready-built solution utilizing the complete Oracle BI Platform.
Oracle BI Platform / Analytical Applications

Oracle BI Analytical Applications come bundled with two main additional pre-built back-end repositories:
•  Business Analytics Warehouse
•  ETL (Extract-Transform-Load) Repository

The Business Analytics Warehouse (BAW) is a completely pre-built data warehouse that physically contains all of necessary dimension and fact table needed for the business intelligence applications. The BAW is fully-compliant with the dimensional modeling methodology developed by Ralph Kimball and supports many advanced techniques including slowly changing dimensions, conformed dimensions, aggregate tables, hierarchy tables, and surrogate keys.

The ETL repository includes all of the routines for extracting of data to a staging area, transforming the data into a common format, the loading of date into data warehouse tables, changed data capture, and seeding data for common dimensions. In addition, the powerful ETL repository consist of two main components, Informatica which is the ETL engine that contains the data integration routines, and the DAC (Data Warehouse Application Console) which is the “ETL orchestration tool” that controls application configuration, execution & recovery, and monitoring.

Oracle Business Intelligence (BI) Platform

The Oracle Business Intelligence (BI) Platform is a set of functions and tools that incorporate a number of advanced business intelligence products.  In addition to providing a broad set of functions and tools, the Oracle BI Platform is built upon a proven, modern web services-oriented architecture that provides the foundation of the construction of complete business intelligence solutions.  In addition, the platform delivers a full range of capabilities related to business intelligence capabilities including…
• Dashboards
• Ad-hoc queries
• Alerts and notifications
• Operational reports
• Predictive intelligence
• Disconnected analytics
• Microsoft Office integration

Fundamentally, the Oracle BI Platform comes with the tools and functions for developing sophisticated custom business intelligence environments like the one pictured here …

Oracle BI - Dashboards

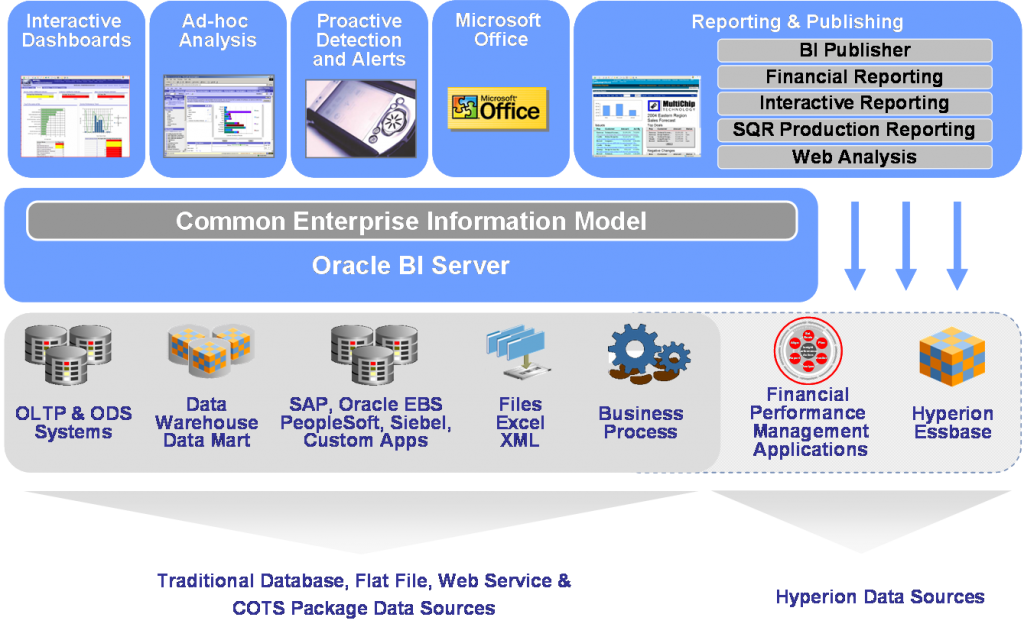
At its core, the Oracle BI Platform is an innovative next-generation business intelligence environment that offers the software tools for building enterprise BI solutions from data spanning both Oracle and non-Oracle data sources and applications. The Oracle BI Platform has been meticulously designed to allow for pervasive use within an organization.  This sophisticated environment includes a full range of easy-to-use and intuitive end-user tools such as interactive dashboards, advanced reporting and publishing, full ad-hoc analysis over the web, proactive detection and alerts, mobile analytics, Microsoft Office integration, web services and business process integration.

The Oracle BI platform provides transparent and seamless access to numerous heterogeneous data sources.  This highly developed platform also allows for development of custom business intelligence implementations that access data from traditional relational databases, OLTP & ODS systems, data warehouses and data marts, flat files, and web services. Further in 2008, Oracle released the Oracle BI Enterprise Edition Plus Platform, which provides direct connections to Hyperion data sources including Essbase and its related financial performance management applications.

Oracle BI - Platform

The Oracle BI Platform has been developed over several years and includes the most advanced features from the former NQuire and Siebel Analytics products recently acquired by Oracle Corporation.

Types of Enterprise Data (Transactional, Analytical, Master)

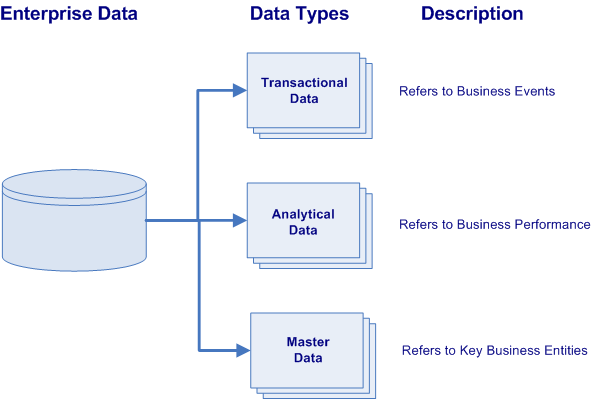
All business enterprises have three varieties of physical data located within their numerous information systems.  These varieties of data are characterized by their data types and their purpose within the organization.
• Transactional Data
• Analytical Data
• Master Data

Data Element Types

Transactional data supports the daily operations of an organization (i.e. describes business events). Analytical data supports decision-making, reporting, query, and analysis (i.e. describes business performance). While master data represents the key business entities upon which transactions are executed and the dimensions around which analysis is conducted (i.e. describes key business entities).

Transactional Data

Transactional data are the elements that support the on-going operations of an organization and are included in the application systems that automate key business processes. This can include areas such as sales, service, order management, manufacturing, purchasing, billing, accounts receivable and accounts payable. Commonly, transactional data refers to the data that is created and updated within the operational systems.  Examples of  transactional data included the time, place, price,discount, payment methods, etc. used at the point of sale. Transactional data is normally stored within normalized tables within Online Transaction Processing (OLTP) systems and are designed for integrity.  Rather than being the objects of a transaction such as customer or product, transactional data is the describing data including time and numeric values.

Analytical Data

Analytical data are the numerical values, metrics, and measurements that provide business intelligence and support organizational decision making. Typically analytical data is stored in Online Analytical Processing (OLAP) repositories optimized for decision support, such as enterprise data warehouses and department data marts. Analytical data is characterized as being the facts and numerical values in a dimensional model. Normally, the data resides in fact tables surrounded by key dimensions such as customer, product, account, location, and date/time. However, analytical data are defined as the numerical measurements rather than being the describing data.

Master Data

Master data is usually considered to play a key role in the core operation of a business. Moreover, master data refers to the key organizational entities that are used by several functional groups and are typically stored in different data systems across an organization.  Additionally, master data represents the business entities around which the organization’s business transactions are executed and the primary elements around which analytics are conducted. Master data is typically persistent, non-transactional data utilized by multiple systems that defines the primary business entities. Master data may include data about customers, products, employees, inventory, suppliers, and sites.

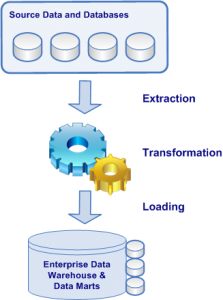
Three Steps in ETL Processing

Steps within ETL Processing

Steps within ETL Processing

The term ETL which stands for extraction, transformation, & loading is a batch or scheduled data integration processes that includes extracting data from their operational or external data sources, transforming the data into an appropriate format, and loading the data into a data warehouse repository. ETL enables physical movement of data from source to target data repository. The first step, extraction, is to collect or grab data from from its source(s).  The second step, transformation, is to convert, reformat, cleanse data into format that can be used be the target database.  Finally the last step, loading, is import the transformed data into a target database, data warehouse, or a data mart.

Step 1 – Extraction
The extraction step of an ETL process involves connecting to the source systems, and both selecting and collecting the necessary data needed for analytical processing within the data warehouse or data mart. Usually data is consolidated from numerous, disparate source systems that may store the date in a different format.  Thus the extraction process must convert the data into a format suitable for transformation processing. The complexity of the extraction process may vary and it depends on the type and amount of source data.

Step 2 – Transformation
The transformation step of an ETL process involves execution of a series of rules or functions to the extracted data to convert it to standard format. It includes validation of records and their rejection if they are not acceptable. The amount of manipulation needed for transformation process depends on the data. Good data sources will require little transformation, whereas others may require one or more transformation techniques to to meet the business and technical requirements of the target database or the data warehouse. The most common processes used for transformation are conversion, clearing the duplicates, standardizing, filtering, sorting, translating and looking up or verifying if the data sources are inconsistent.

Step 3 – Loading
The load is the last step of ETL process involves importing extracted and transformed data into a target database or data warehouse. Some load processes physically insert each record as a new row into the table of the target warehouse utilizing a SQL insert statement.  Whereas other load processes include a massive bulk insert of data utilizing a bulk load routine.  The SQL insert is a slower routine for imports of data, but does allow for integrity checking with every record. The bulk load routine may be faster for loads of large amounts of data, but does not allow for integrity check upon load of each individual record.

Read more

Advantages of KPI Scorecarding

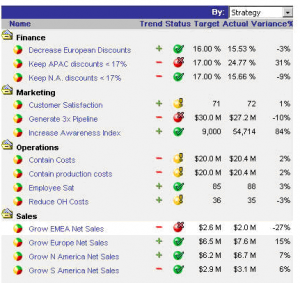
A KPI scorecard is a solution that allows organizations to manage their organizational performance by linking operations with strategy. The scorecard monitors the execution of strategic objectives at each level of the organization and ensures a consistent understanding at all levels of the organization’s priorities and expectations.

Sample KPI Scorecard

Sample KPI Scorecard

Scorecards can be utilized at all levels of an organization including executives, managers and staff. They are usually updated in periodic snapshots, use graphical symbols and icons to present summaries of organizational performance, and chart overall progress over time for the organization.

Scorecards provide value to the organization by linking key performance indicators (KPIs) within tactical and operational levels in an organization to the overall strategy of the organization. In addition, the scorecard establishes accountability to appropriate individuals and enables visibility to up and down an organization from executive management to operational levels. The scorecard can be a powerful tool to allow for assignment of goals and objectives to all individuals and focuses accountability on the relevant individuals and business units.

Typically scorecards provide internal and industry benchmarks, goals, and targets that assist an individual’s understanding of their own unique contribution to the organization. Often, the scorecard spans strategic, tactical, and operational aspects and decisions of the organization and supports the specific demands of varying levels of management.

Benefits and Advantages of KPI Scorecards to an organization include…
•  Scorecards drive improved organizational performance
•  Scorecards translate strategy into concrete terms and help track its execution
•  Scorecards help ensure that the right measures are utilized
•  Scorecards encourage the right balance of operational and strategic factors
•  Scorecards encourage good management
•  Scorecards present a compelling picture of performance that is not distorted an individual issue