Column and Row Based Database Storage

TableRowColumnStore_320x9999
Row-Based Database Storage:
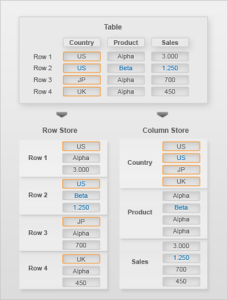
The data sequence consists of the data fields in one table row.
Column-Based Database Storage:
The data sequence consists of the entries in one table column.

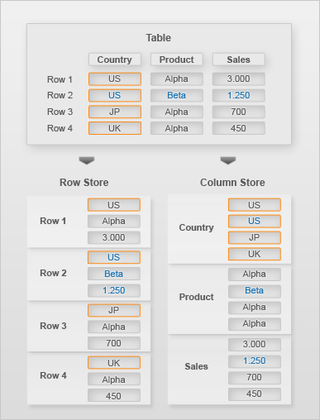
Conceptually, a database table is a two-dimensional data structure with cells organized in rows and columns. However, computer memory is organized as a linear sequence. For storing a database table in linear memory, two options can be chosen (row based storage or column based storage). Row based storage stores a sequence of records that contain the fields of one row in the table. In column based storage, the entries of a column are stored in contiguous memory locations.

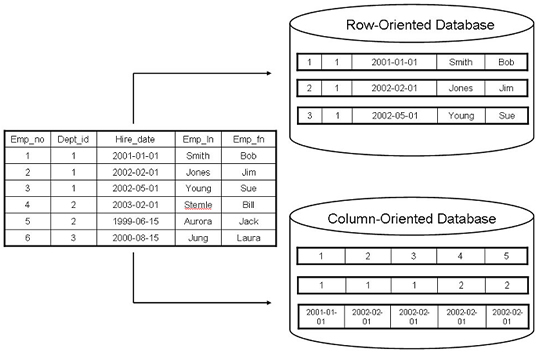
Row-based database systems are designed to efficiently return data for an entire row, or record, in as few operations as possible. This matches the common use-case where the system is attempting to retrieve information about a particular object. This is particularly useful for transactional systems that conduct large amounts of inserts, updates, and deletes of records.

Column-based database systems combine all of the values of a column together, then the values of the next column, and so on. Within this layout, any one of the columns more closely matches the structure of an index in a row-based system. The goal of a columnar database is to efficiently write and read data to and from hard disk storage in order to speed  up performance of select queries. This is particularly useful for systems that conduct large amounts of analytics.

Column-oriented-database

Row-based storage is recommended for transactional systems or when:

•  The table has a small number of rows, such as configuration tables.
•  The application needs to conducts updates of single records.
•  The application typically needs to access the complete record.
•  The columns contain mainly distinct values so the compression rate would be low.
•  Aggregations and fast searching are not required.

Column-based storage is recommended for analytical systems or when:

•  Calculations are executed on a single column or a few columns only.
•  The table is searched based on the values of a few columns.
•  The table has a large number of columns.
•  The table has a large number of records.
•  Aggregations and fast searching on large tables are required.
•  Columns contain only a few distinct values, resulting in higher compression rates.

MS SQL Server Indexed View Defined

For many years and versions, the MS SQL Server database platform has supported the ability to create virtual tables known as views.  Views in SQL Server can be defined as a stored select statement on a base table.  Data in a view is not stored in the database and the result set is determined while the view is executed. Traditionally, views provide a security mechanism that restricts users to a certain subset of data in one or more base tables or provide a mechanism that allow developers to customize how users can logically view the data stored in base tables.  Prior to the addition of indexed views in SQL Server, views never contained indexes of their own.

Starting with Microsoft SQL Server 2000, indexed views are views whose results are persisted in the database (similar to tables) and contain database indexes for fast retrieval of data.  A database index is a data structure that improves the speed of data retrieval operations on a database table at the cost of slower writes and increased storage space.  Indexed views work best when the underlying data is infrequently updated. The maintenance of an indexed view can be higher than the cost of maintaining a table index. If the underlying data is updated frequently, then the cost of maintaining the indexed view data may outweigh the performance benefits of using the indexed view.

The main benefit of an indexed view is query optimization and faster query performance. Because the indexed view physically exists on disk, there can be substantial savings in response time to queries that involve the indexed view. Additionally data within the  indexed view can store joins between tables, can store a subset of fields and/or records that exist within a table, can store calculations of table fields, and can store aggregations or groupings of data.  Thus less data is retrieved in a query of  the the indexed table than the  query of the base tables.  And finally, indexed views utilize performance-enhancing indexes corresponding to its own data where ordinary views only utilize indexes related to the indexes in its base table.

The main costs of an indexed view are additional maintenance of the indexes, additional disk space taken up by both the indexed view and related indexes, additional overhead of maintaining the view on disk as the base tables are modified. One must weigh the cost to maintain the index against the benefit of query optimization provided by the index. When the underlying tables are subject to significant inserts, updates, and deletes, be very careful in selecting the indexes (both table and view) that will provide the greatest coverage across your queries for the lowest cost.

Typically, environments that are best suited for indexed views are analytical data repositories such as data warehouses and data marts. Analytical data repositories require rapid query speeds and the underlying data changes infrequently.

The syntax to create a Indexed View in SQL Server is:

CREATE VIEW IndexView
WITH SCHEMABINDING
    AS SELECT Au_Fname + ‘ ‘ + Au_Lname, Au_id FROM Authors WHERE Contract = 1 GO
CREATE UNIQUE CLUSTERED Index MyINDEX ON IndexView (au_id) Go

Oracle’s Materialized View Defined

materialized view within an Oracle database is an object that extends the functionality of an ordinary view and contains the results of a query (SQL select statement) in a persistent or physical format. Materialized views can use either tables, views, and other materialized views as its data source and can be both indexed and/or refreshed.

Within an Oracle database, a view is a virtual table representing the result of a database query or select command with a table or another view as its source.  Whenever a select query or an update addresses a view, the database converts these statements into select queries or updates against the source tables of the view’s select query.  Thus a view is just a stored query or virtual table with no storage of physical data, and the physical data is stored in a table.  However, a materialized view takes a different approach in which the query result is cached as a concrete table that can be refreshed from the source tables of the select query. This enables better query performance, at the cost of some data being potentially out-of-date.

Because a materialized view is manifested as a physical table, anything that can be performed to a real table can be done to the materialized view. With the most important thing that can be performed is the ability to build indexes on any field, enabling drastic speedups in query performance time. In a view, it’s typically only possible to utilize indexes on columns that come directly from (or have a mapping to) indexed columns in the source table.  In addition, a materialized view can contain denormalized data that physically exists in multiple tables, a subset of fields and records that exist in physical tables, pre-calculation of table fields, and data pre-aggregated at summary levels.

Materialized views are most useful in analytical data repositories such data warehouses or data marts, where query performance is important and data refreshes and updates occur infrequently. Materialized views are one of the single most important database tuning tools that exist allowing you to pre-join complex table and views and pre-compute summaries for fast response time of queries.

Create Materialized View Syntax

Create Materialized View DeptCheckMV
Start with Sysdate
As
Select * From EmployeeTbl
Where Salary > (Select avg (salary) from EmployeeTbl

Balanced Scorecard Defined

Balanced Scorecard is a performance management tool used by executives and managers to manage the execution of organizational activities and to monitor the results of actions.  Fundamentally a balanced scorecard provides a summary level view of organizational performance at a quick glance and includes key performance indicators (KPIs) across four main areas or perspectives:

Financial Perspective:  KPIs for productivity, revenue, growth, usage, and overall shareholder value.
Customer Perspective: KPIs for customer acquisition, customer satisfaction rates, market share, and overall brand strength.
Internal Process Perspective:  KPIs for resource usage, inventory turnover rates, order fulfillment, and quality control.
Learning / Growth Perspective:  KPIs for employee retention, employee satisfaction, and employee education, training, and development.

Balanced Scorecard - Four Perspectives

Balanced Scorecard – Four Perspectives

The balanced scorecard concept was originated by Drs. Robert Kaplan (Harvard Business School) and David Norton as a framework for managing and measurement organizational performance.  The concept added strategic non-financial performance measures to traditional financial metrics to provide executives and managers a more ‘balanced’ and ‘holistic’ view of organizational performance.  Over time the balanced scorecard has evolved from its early use as a simple performance measurement tool to a complete strategic planning and management system. The latest version of the balanced scorecard transforms an organization’s strategic plan from a passive document into the active actions the organization needs to perform on a daily basis. Additionally, it provides a framework that not only provides performance measurements, but helps planners identify what should be performed and what should be measured.

Adapted from Microsoft Technet and Balanced Scorecard Institite.

Crystal Reports 2011 / Crystal Reports for Enterprise

With the release of SAP Business Objects 4.0 in 2011, there now exist two distinct current versions of Crystal Reports (Crystal Reports 2011 and Crystal Reports for Enterprise).  In building the latest release of Crystal Reports, the goal was to create an enhanced developer interface and the best possible connectivity with the new semantic / universe layer in SAP Business Objects 4.0.  But the new release needed to also have zero disruption in the use of legacy and existing Crystal Reports.  Subsequently, SAP Business Objects has released a new version of the product that is similar to the existing product (i.e. Crystal Reports 2011) and a next-generation product that has a completely been redeveloped and includes a new user interface and new underlying architecture (i.e. Crystal Reports for Enterprise).

Crystal Reports 2011
•  Incremental update to CR 2008 with a few new features
•  Focused on serving the needs of legacy customers
•  Delivers existing functionality with no regressions
•  Seamless upgrades from legacy releases of Crystal Reports
Crystal Reports for Enterprise
•  Major update & re-design of the Crystal Reports Designer
•  Connectivity with new unx universe / semantic layer
•  Enhanced report design tool (smart formatting)
•  Many new features and functions
•  Some regression of functionality
•  Limitation to universe as a data source
SAP Business Objects has determined the Crystal Reports for Enterprise is the future of the Crystal Reports product line and subsequently it provides the foundation for all future releases of Crystal Reports.  To this end, there are a number of completely new features in Crystal Reports for Enterprise including:
•  Smart Formatting of Reports
•  Streamlined Tab Control User Interface
•  New Charting Engine
•  New Multilingual Support
•  New Alerting Mechanism
•  Enhanced Connectivity with Universes
•  Enhanced Connectivity with SAP BW

Of the many features in Crystal Reports for Enterprise, there exists one that will fundamentally change how developers interact with reports. This new feature is called Smart Formatting and it will greatly enhance report developer efficiency.  With smart formatting, the Crystal Reports Designer automatically detects patterns in report formatting. And upon changes to the report, the designer will rapidly adjust the design of the report.

Crystal Reports for Enterprise - Smart Formatting

Crystal Reports for Enterprise – Smart Formatting

Features of Smart Formatting in Crystal Reports for Enterprise include:
•  Automatic Resizing Of Colum Upon Object And Column Insertion
•  Automatic Column Shifting Upon Object And Column Insertion
•  Guidelines For Easy Column Resizing
•  Ability To Drag And Drop To Reorder Columns
There are also number of features that have not been incorporated within the initial release of Crystal Reports for Enterprise.  These regressed features that are not included in Crystal Reports for Enterprise v4.0 include:
•  No Native Connections to Database
•  No Support for Database Connectivity (ODBC, JDBC)
•  No Support for OLAP as a Data Source (except BEx Queries)
•  No Support for Live Office
•  No Support for Enterprise Search
•  Gaps within API and SDK

Operational BI vs Strategic BI

Operational Business Intelligence

Operational business intelligence is often associated with reporting from a transactional or operational data source, and typically is consistent with reporting of data within or during an organizational business process. Further, operational business intelligence can be defined as analytics that is tightly connected or embedded within common business processes with the twin goals of supporting operational decision making and monitoring organizational operations.

Operational Business Intelligence

In general, operational business intelligence provides time-sensitive, relevant information to operations managers, business professionals, and front-line, customer-facing employees to support daily work processes. Additionally if the data retrieved from the analysis directly supports or helps complete an operational tasks, then the intelligence is operational in nature.

Tangible results of operational business intelligence can include:
•  Invoices
•  Meeting Schedules and Badges
•  Receipts
•  Shipping Documents
•  Financial Statements
•  Marketing Mailing Lists

Strategic Business Intelligence

Strategic business intelligence is often associated with reporting from an analytical data source, data mart, or data warehouse. Fundamentally, strategic business intelligence improves a business process by analyzing a predetermined set of metrics relevant to that process and provides historical context of data.  In addition, strategic intelligence provides the basis for forecasting, goal-setting, and strategic planning and direction.

Strategic Business IntelligenceThe focus of strategic business intelligence is on (1) collection, organization and storage of huge amounts of data, (2) optimization of that data for rapid reporting and analysis, (3) and identification of key business drivers through the analysis of historical facts, (4) assistance with answering key business questions.

Questions answered by strategic business intelligence can include:
•  Who are the most valuable customers?
•  Which customers are most likely to buy additional products / services?
•  Which products can be bundled together?
•  Which territories or regions have the highest project growth?
•  What is the optimal price of our products?
•  What is the total cost associated with customer acquisition?

Dimensional Modeling – Conformed Dimensions

Conformed DimensionsIn dimensional modeling, conformed dimensions are common and repeatedly used dimensions that relate and are joined to multiple facts. The conformed dimension is consistent across an enterprise and has the same meaning to every fact with which it relates. Typically, a conformed dimension exists as a single dimension table and relates to multiple fact tables within the same data warehouse. But the conformed dimension can also exist as identical dimension tables in separate data marts. In a nutshell, conformed dimensions allow facts and measures to be categorized and described in the same way across dimensional stars and/or data marts, ensuring consistent reporting across an enterprise.

Properties of Conformed Dimensions:
•  Dimensions that are joined to multiple fact tables
•  Exist in multiple star schemas and/or data marts
•  Same meaning with every fact table join
•  Allow various fact tables to be used in the same query
•  Same structure and attributes in every model
Common Conformed Dimensions:
•  Customer
•  Product
•  Date/Time
•  Employee
•  Account
•  Region or Territory
•  Vendor

Business Objects Live Office

Live Office from SAP Business Objects integrates business intelligence functionality from the Business Objects suite within the commonly-used Microsoft Office environment. Subsequently Live Office enables users are able to embed refreshable information within documents, spreadsheets, and presentations and share them across their organization. Live Office provides users with real-time data that is verifiable and easily refreshed. As Live Office is built directly into Microsoft Office applications, needed information is available at the user’s finger tips and is available in a familiar, easy to use format. In a nutshell, Live Office empowers business users to easily access corporate data from within Microsoft Office Excel, Word, Outlook, and PowerPoint without depending on expertise from the information technology department.

Live Office PowerPoint Sample

Benefits of Business Objects Live Office
•  Access business intelligence (BI) content directly within Microsoft Office.
•  Embed business intelligence directly in your e-mail messages using Microsoft Outlook.
•  Format and perform calculations using familiar features of Excel, PowerPoint, and Word.
•  Increase business user autonomy by exposing corporate data in Microsoft Office documents, spreadsheets, and presentations rather than web applications.
•  Improve timelines of decisions by enabling simpler information consumption.
•  Become less dependent on information technology personnel for generation of reports.

Operational, Tactical, & Strategic Dashboards

Xcelsius DashboardAs your organization seeks to better understand its customer and manage a diverse line of services and products, operational, tactical and strategic dashboards should become a critical addition to your planning and decision-making toolbox. Whether the dashboard provides your Executive Director a 30,000-foot view of the organization as a whole, or the product line manager an interactive interface which allows exploration into the details of a particular product’s performance, your organization can benefit a well-built dashboard.

Achieving accuracy and consistency for all dashboards within an organization can be both a challenging and expensive task. To this end, TMA Resources delivers three categories of dashboards to its customers to ensure that the right type of presentation is delivered to your organization’s decision–makers …

• Operational Dashboards: Continuously monitor core business processes with real-time transactional data. Alert your managers upon thresholds being exceeded or upon an exception in the data.

• Tactical Dashboards: Provide the department manager with a quick view into how his or her department is performing and highlight areas of concern—so the manager can take action to forestall less-than-optimal performance.

• Strategic Dashboards: Provide senior managers and executives with a glance of the organization’s performance in relation to strategic goals. These dashboards are typically based upon data residing in one of the organizations data warehouses or data marts and contain time-stamped snapshots of data.

Key Benefits of a Data Warehouse

Cool Data Warehouse

Data Warehouses are centralized data repositories that integrate data from various transactional, legacy, or external systems, applications, and sources. The data warehouse provides an environment separate from the operational systems and is completely designed for decision-support, analytical-reporting, ad-hoc queries, and data mining. This isolation and optimization enables queries to be performed without any impact on the systems that support the business’ primary transactions (i.e transactional and operational systems). Read more