Posts

Business Intelligence Capability – Data Visualization

Overview of Data Visualization Solutions

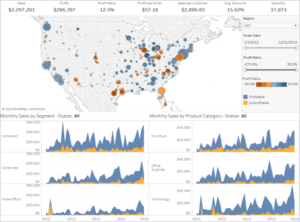
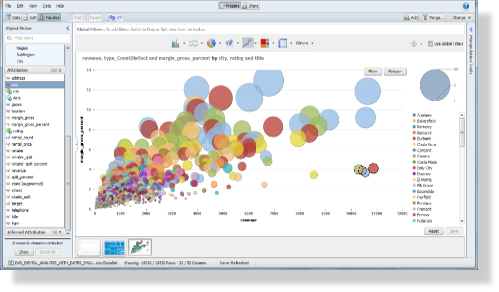
Data Visualization Solutions enable analysis by providing highly-graphical representations of information and data. By using visual elements including charts, graphs, and maps, data visualization is an accessible way to see and understand trends, outliers, and patterns in data. Further, data visualization refers to the techniques used to communicate data or information by encoding it as visual objects contained within graphics.

Data visualization tools go beyond the display of basic charts and graphs. Moreover, they display data in more sophisticated ways such as geographic maps, infographics, dials, gauges, sparklines, heat maps, networks, graphs, and charts. The images may include interactive capabilities, enabling users to manipulate them or drill into the data for querying and analysis.  Additionally, numerical data may be encoded within graphics using dots, lines, circles, bubbles, or bars, to visually communicate a quantitative message. Indicators designed to alert users when data has been updated or predefined conditions occur can also be included.  Because of the way the human brain processes information, using graphics to visualize large amounts of data is for more effective for rapid analysis then just looking at data within queries and reports.  Effective data visualization assists users to analyze and reason about data and to draw conclusions. These types of analytical tools make complex data sets more intuitive, understandable, and usable for decision-making.


Characteristics of Data Visualization Solutions

•  Highly graphical presentation of data.
•  Intuitive user interface with visual presentation of data.
•  Rapid comprehension of data.
•  Comparison of different pieces of data.
•  Ease of interpretation of data.
•  Quantitative evaluation of data.
•  Presents numerous numerical metrics in a relatively small space.
•  Numerical data encoded within graphics using dots, lines, circles, bubbles, or bars.
•  Reveals data at several levels of detail and perspectives.
•  Indication of data relationships, patterns, and outliers.
•  Makes large data sets coherent.
•  Enables analysis of trends.
•  Identification of data indicators.
•  Conversion of data into information.

Share

Business Intelligence Capability – Data Exploration

Overview of Data Exploration Solutions

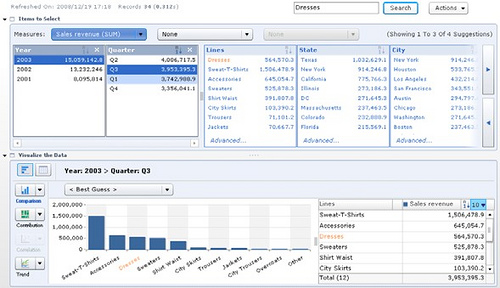
Data Exploration Solutions enable robust visual searches of vast amounts of data and are commonly used by data analysts.

Data Exploration Solutions include sophisticated data discovery capabilities that enable users to rapidly and intuitively search through large amounts of data in order to gain insights.  Subsequently data exploration solutions enable users to quickly retrieve answers about organizational data and enable users to quickly generate information about the data.  In addition data exploration solutions provide informative search capabilities in order to enable analysis of the available data and enable conversion of the data into information.  While data exploration solutions do enable queries of data, the data is exposed to users using business terminology and underlying database structures and data models are hidden to the user.

SAP BusinessObjects Explorer

Characteristics of Data Exploration Solutions

•  Rapid searches of large data sets
•  Sophisticated data discovery capabilities
•  Intuitive user interface with keyword searches
•  Filtering of data from multiple dimensions or perspectives
•  Drill-down, drill-up capabilities
•  Visualization of data in multiple formats
•  Integration with central databases and data warehouses
•  Guided discovery of data with contextual navigation
•  Abstraction of underlying database and data models
•  Conversion of data into information
Share

Column and Row Based Database Storage

TableRowColumnStore_320x9999
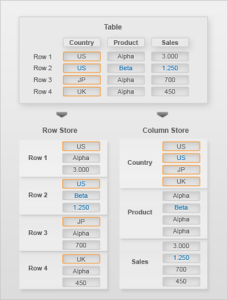
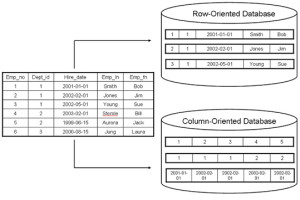
Row-Based Database Storage:
The data sequence consists of the data fields in one table row.
Column-Based Database Storage:
The data sequence consists of the entries in one table column.

Conceptually, a database table is a two-dimensional data structure with cells organized in rows and columns. However, computer memory is organized as a linear sequence. For storing a database table in linear memory, two options can be chosen (row based storage or column based storage). Row based storage stores a sequence of records that contain the fields of one row in the table. In column based storage, the entries of a column are stored in contiguous memory locations.

Row-based database systems are designed to efficiently return data for an entire row, or record, in as few operations as possible. This matches the common use-case where the system is attempting to retrieve information about a particular object. This is particularly useful for transactional systems that conduct large amounts of inserts, updates, and deletes of records.

Column-based database systems combine all of the values of a column together, then the values of the next column, and so on. Within this layout, any one of the columns more closely matches the structure of an index in a row-based system. The goal of a columnar database is to efficiently write and read data to and from hard disk storage in order to speed  up performance of select queries. This is particularly useful for systems that conduct large amounts of analytics.

Column-oriented-database

Row-based storage is recommended for transactional systems or when:

•  The table has a small number of rows, such as configuration tables.
•  The application needs to conducts updates of single records.
•  The application typically needs to access the complete record.
•  The columns contain mainly distinct values so the compression rate would be low.
•  Aggregations and fast searching are not required.

Column-based storage is recommended for analytical systems or when:

•  Calculations are executed on a single column or a few columns only.
•  The table is searched based on the values of a few columns.
•  The table has a large number of columns.
•  The table has a large number of records.
•  Aggregations and fast searching on large tables are required.
•  Columns contain only a few distinct values, resulting in higher compression rates.
Share

Operational BI vs Strategic BI

Operational Business Intelligence

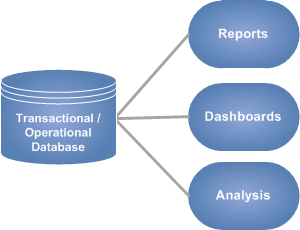
Operational business intelligence is often associated with reporting from a transactional or operational data source, and typically is consistent with reporting of data within or during an organizational business process. Further, operational business intelligence can be defined as analytics that is tightly connected or embedded within common business processes with the twin goals of supporting operational decision making and monitoring organizational operations.

Operational Business Intelligence

In general, operational business intelligence provides time-sensitive, relevant information to operations managers, business professionals, and front-line, customer-facing employees to support daily work processes. Additionally if the data retrieved from the analysis directly supports or helps complete an operational tasks, then the intelligence is operational in nature.

Tangible results of operational business intelligence can include:
•  Invoices
•  Meeting Schedules and Badges
•  Receipts
•  Shipping Documents
•  Financial Statements
•  Marketing Mailing Lists

Strategic Business Intelligence

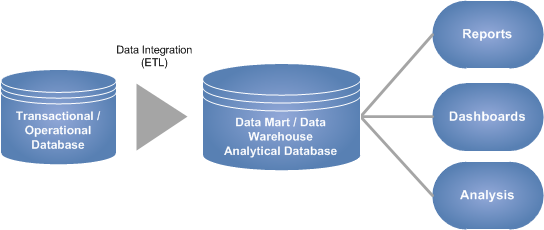
Strategic business intelligence is often associated with reporting from an analytical data source, data mart, or data warehouse. Fundamentally, strategic business intelligence improves a business process by analyzing a predetermined set of metrics relevant to that process and provides historical context of data.  In addition, strategic intelligence provides the basis for forecasting, goal-setting, and strategic planning and direction.

Strategic Business IntelligenceThe focus of strategic business intelligence is on (1) collection, organization and storage of huge amounts of data, (2) optimization of that data for rapid reporting and analysis, (3) and identification of key business drivers through the analysis of historical facts, (4) assistance with answering key business questions.

Questions answered by strategic business intelligence can include:
•  Who are the most valuable customers?
•  Which customers are most likely to buy additional products / services?
•  Which products can be bundled together?
•  Which territories or regions have the highest project growth?
•  What is the optimal price of our products?
•  What is the total cost associated with customer acquisition?
Share

Key Benefits of a Data Warehouse

Cool Data Warehouse

Data Warehouses are centralized data repositories that integrate data from various transactional, legacy, or external systems, applications, and sources. The data warehouse provides an environment separate from the operational systems and is completely designed for decision-support, analytical-reporting, ad-hoc queries, and data mining. This isolation and optimization enables queries to be performed without any impact on the systems that support the business’ primary transactions (i.e transactional and operational systems). Read more

Share

Components of SAP BusinessObjects: Web Intelligence (WebI)

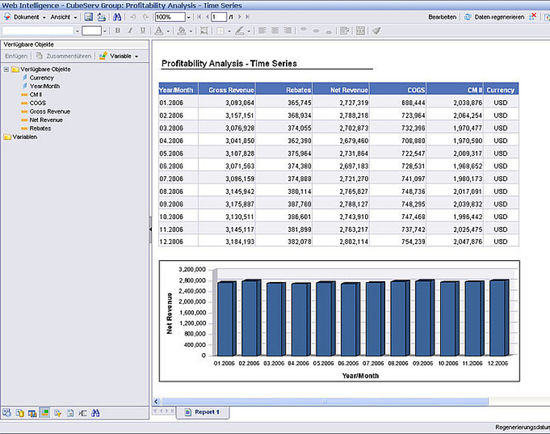
Web Intelligence (WebI) is an ad-hoc query and reporting environment within the SAP BusinessObjects suite of products. Fundamentally, it is an environment that provides self-service access to data.  Web Intelligence contains reporting, querying, and information analysis in one integrated product, helping end-users turn business insights into effective decisions.  With just a few clicks of the mouse, WebI users can quickly access and format information as well as easily analyze information to understand underlying trends and root causes.

Web Intelligence contains a highly-interactive data interface that allows the report user a great deal of flexibility to view data from different perspectives.  Although many report users may only need to build their reports from scratch, it is often necessary for the users to adjust reports to answer current business questions. With Web Intelligence, users can easily edit queries and reports to reflect their latest information needs.

WebInteligence (WebI) - Sample Report

WebInteligence (WebI) – Sample Report

The following options can be taken advantage by user of Web Intelligence …
• View, edit, remove report, section, or block filters
• Format and re-size cells, tables, and charts
• Set breaks and sorts
• Insert calculations
• Add rows and columns to tables
• Create and duplicate tables and charts
• Turn a grid into a chart or a chart into a grid
• Create formulas and variables
• Edit cell formulas in place
• Recombine report objects within tables and charts

Read more

Share

Components of SAP BusinessObjects: Crystal Reports

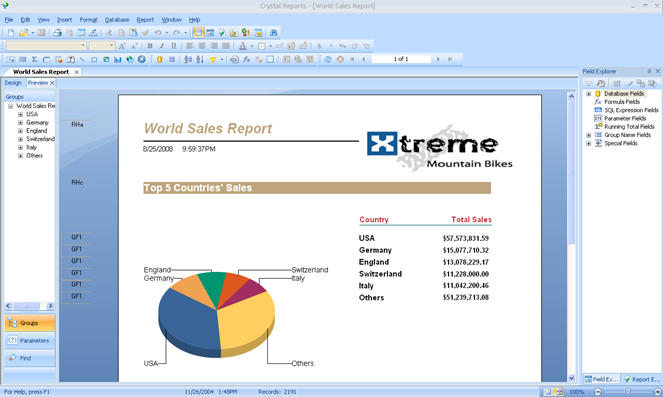
Crystal Reports is an operational reporting environment and component of the SAP BusinessObjects suite of products.  Fundamentally, it is a tool that enables report authors to easily design interactive reports and connect them to virtually any data source. It is the ideal solution for canned or published reports as it allows for the creation of high-fidelity, pixel-perfect reports. Additionally, end-users benefit from on-report sorting and filtering – giving them the power to execute decisions instantly.

More details and graphics of Crystal Reports can be found on the Portfolio Page.

Crystal Reports - Sample Report in Designer Tool

Crystal Reports – Sample Report in Designer Tool

With Crystal Reports, report authors and end-users can leverage an intuitive interface, access data spread across multiple systems, design reports with guided interactivity, and embed reports within both client-server and web applications.  Crystal Reports can be used for report design, application development, and web report delivery.

Read more

Share

Oracle Business Intelligence (BI) Analytical Applications

Rather than just being a platform or development environment, Oracle Business Intelligence (BI) Analytical Applications are fully inclusive business intelligence solutions that incorporate all of the key metrics, workflows, and business processes for a particular business function.  Bundled within theses solutions are numerous pre-built components including:
•  Dashboards
•  Metrics
•  Reports
•  Drill-down paths
•  Dimensional models
•  Naming standards
•  Database objects
•  ETL routines
•  Metadata
•  Security

In addition, Oracle BI Analytical Applications contain universal adapters that allow for rapid integration and direct connections with leading commercial-off-the shelf (COTS) packages including SAP, Oracle E-Business Suite, PeopleSoft, and Siebel applications systems.

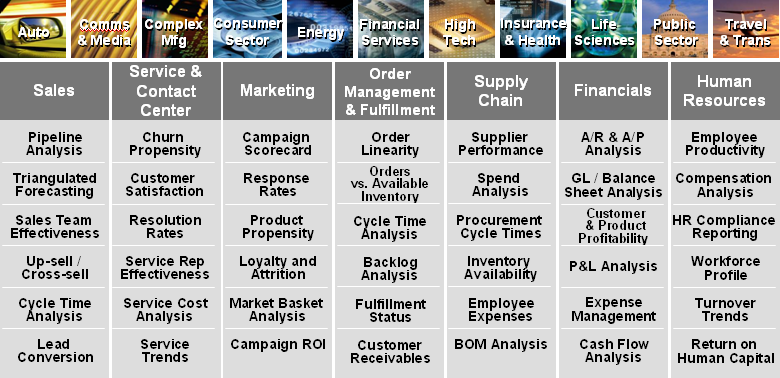
Oracle BI Analytical Applications come bundled with best practices and industry standards built-in. Additionally, they include all of the functionality required to conduct business intelligence for many common business functions including financials, human resources, sales, service, contact centers, marketing, supply chains, order management and fulfillment business areas.

Oracle BI Analytical Application Modules

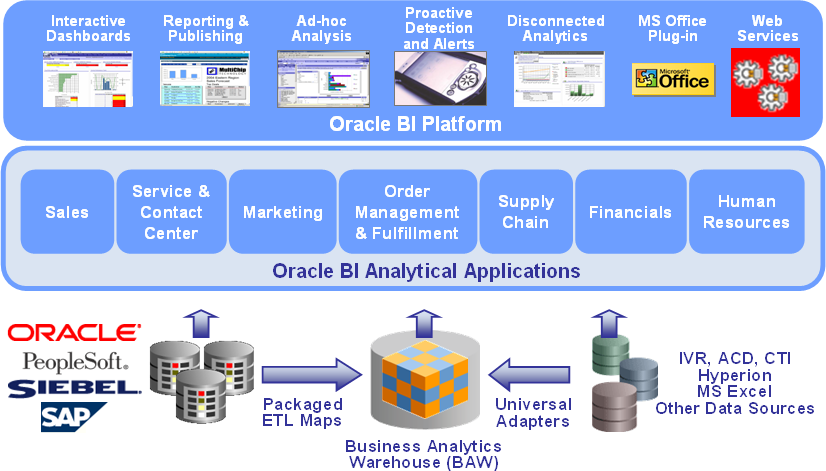
Fundamentally, Oracle BI Analytical Applications are built upon the Oracle BI Platform and provide complete end-to-end, prebuilt business intelligence solutions that deliver intuitive, role-based intelligence to all members of an organization including senior executives, mid-level managers, and front-line employees.  So rather than developing custom business intelligence solutions for each business area and function, the use of Oracle BI Analytical Applications allows an organization the ability to rapidly configure a ready-built solution utilizing the complete Oracle BI Platform.

Oracle BI Platform / Analytical Applications

Oracle BI Analytical Applications come bundled with two main additional pre-built back-end repositories:
•  Business Analytics Warehouse
•  ETL (Extract-Transform-Load) Repository

The Business Analytics Warehouse (BAW) is a completely pre-built data warehouse that physically contains all of necessary dimension and fact table needed for the business intelligence applications. The BAW is fully-compliant with the dimensional modeling methodology developed by Ralph Kimball and supports many advanced techniques including slowly changing dimensions, conformed dimensions, aggregate tables, hierarchy tables, and surrogate keys.

The ETL repository includes all of the routines for extracting of data to a staging area, transforming the data into a common format, the loading of date into data warehouse tables, changed data capture, and seeding data for common dimensions. In addition, the powerful ETL repository consist of two main components, Informatica which is the ETL engine that contains the data integration routines, and the DAC (Data Warehouse Application Console) which is the “ETL orchestration tool” that controls application configuration, execution & recovery, and monitoring.

Share

Oracle’s Business Intelligence Foundation

Oracle Business Intelligence LogoOracle’s Business Intelligence Foundation is a complete enterprise business intelligence solution that delivers capabilities for reporting, ad-hoc query and analysis, OLAP, dashboards, and scorecards.  In addition, the Oracle BI Foundation includes a common enterprise information model, which is a unified metadata model accessed by end user tools, allowing a  “model once and deploy everywhere” paradigm.  In addition, the Oracle BI Foundation allows users to access and interact with information in multiple ways, including web-based dashboards, collaboration workspaces, search bars, ERP and CRM applications, mobile devices, and MS Office applications.

Product Areas of Oracle BI Foundation

•  Oracle Business Intelligence Suite Enterprise Edition Plus (OBIEE Plus)
•  Oracle Business Intelligence Standard Edition One  (OBISE One)
•  Oracle Business Intelligence Standard Edition (OBISE)
•  Oracle BI Publisher
•  Oracle Essbase
•  Oracle Real-Time Decisions (RTD)
•  Oracle Scorecard and Strategy Management
•  Oracle Essbase Analytics Link

Read more

Share

Primary Components of Business Intelligence Systems

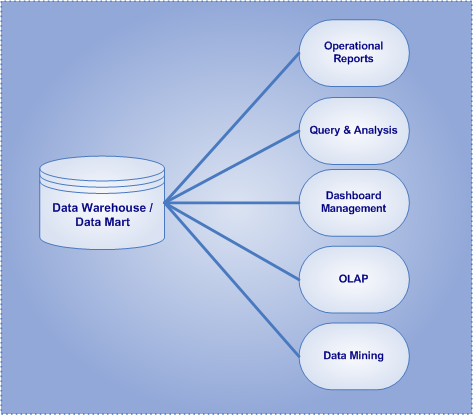
Business Intelligence (BI) systems are software applications that enable better understanding of organizational data and provide the information organizations need to make enlightened decisions. Moreover, business intelligence systems are primarily focused on reporting, querying, and analysis of data residing in an enterprise data warehouse (EDW), and both dependent and independent data marts.

Primary Components of Business Intelligence (BI)

Primary Components of Business Intelligence (BI)

Fundamentally, there are five categories of business intelligence applications…

•  Operational Reports:  Displays data with rich presentation and within a structured layout (i.e. rows and columns).
•  Query and Analysis:  Interactive methods to query data, present data in an ad-hoc manner, and to find information on an as-needed basis.
•  Dashboard Management:  Graphical interfaces and real-time methods to provide guided analysis and to intuitively monitor organizational metrics.
•  On-line Analytical Processing (OLAP):  The capability of manipulating and analyzing data from multiple perspectives in a rapid fashion.
•  Data Mining & Predictive Analytics:  Utilizing statistics, algorithms, and sophisticated data search capabilities to discover hidden patterns and relationships in data and project future results.

Read more

Share