Primary Components of Business Intelligence Systems

Business Intelligence (BI) systems are software applications that enable better understanding of organizational data and provide the information organizations need to make enlightened decisions. Moreover, business intelligence systems are primarily focused on reporting, querying, and analysis of data residing in an enterprise data warehouse (EDW), and both dependent and independent data marts.

Primary Components of Business Intelligence (BI)

Primary Components of Business Intelligence (BI)

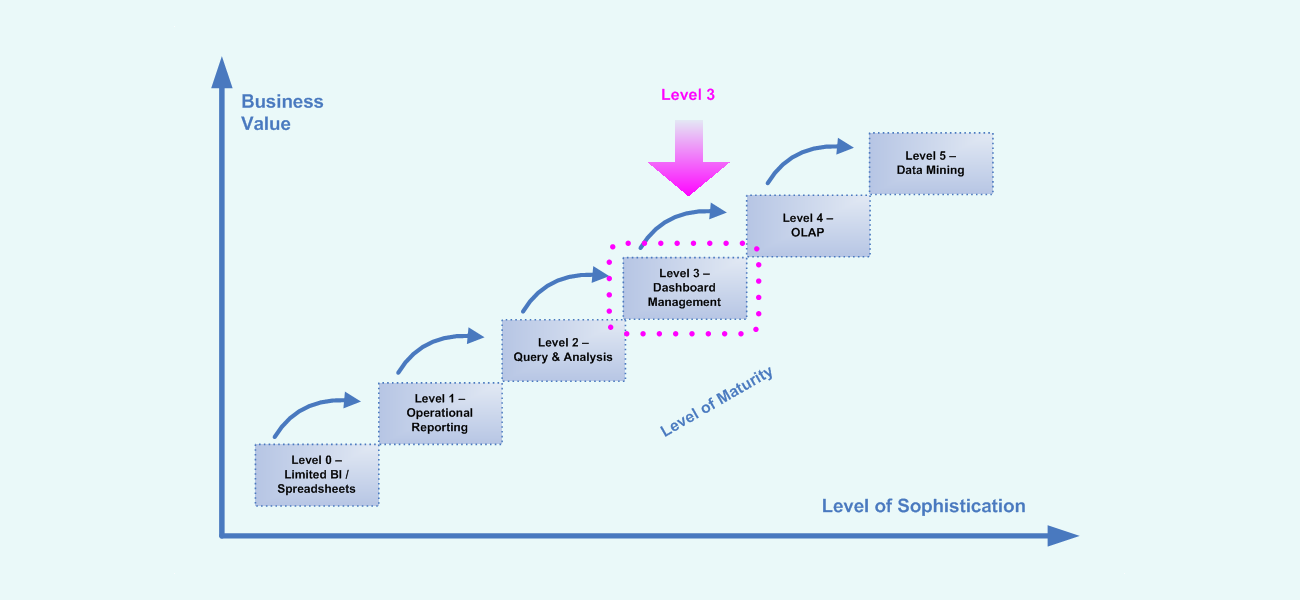
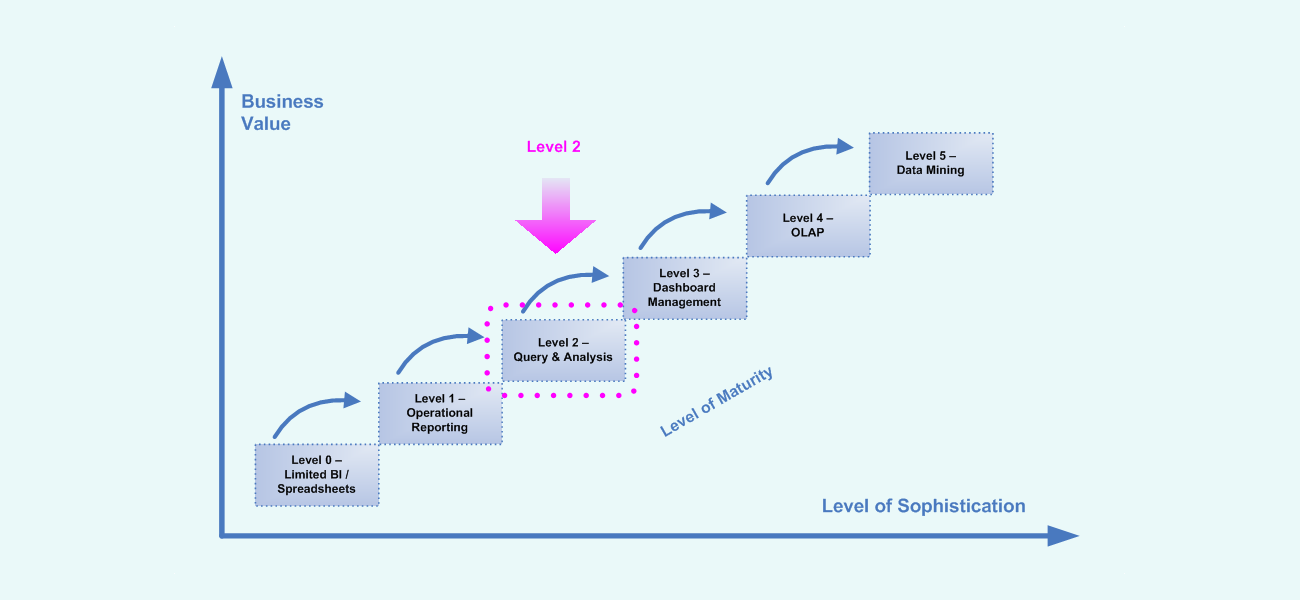
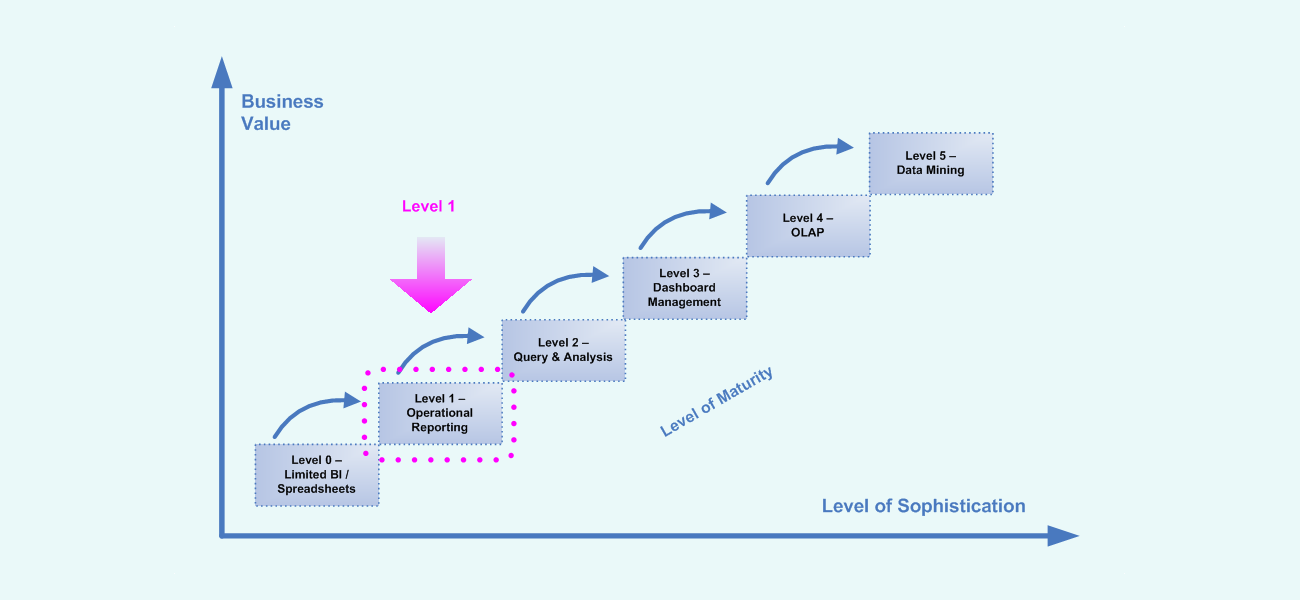
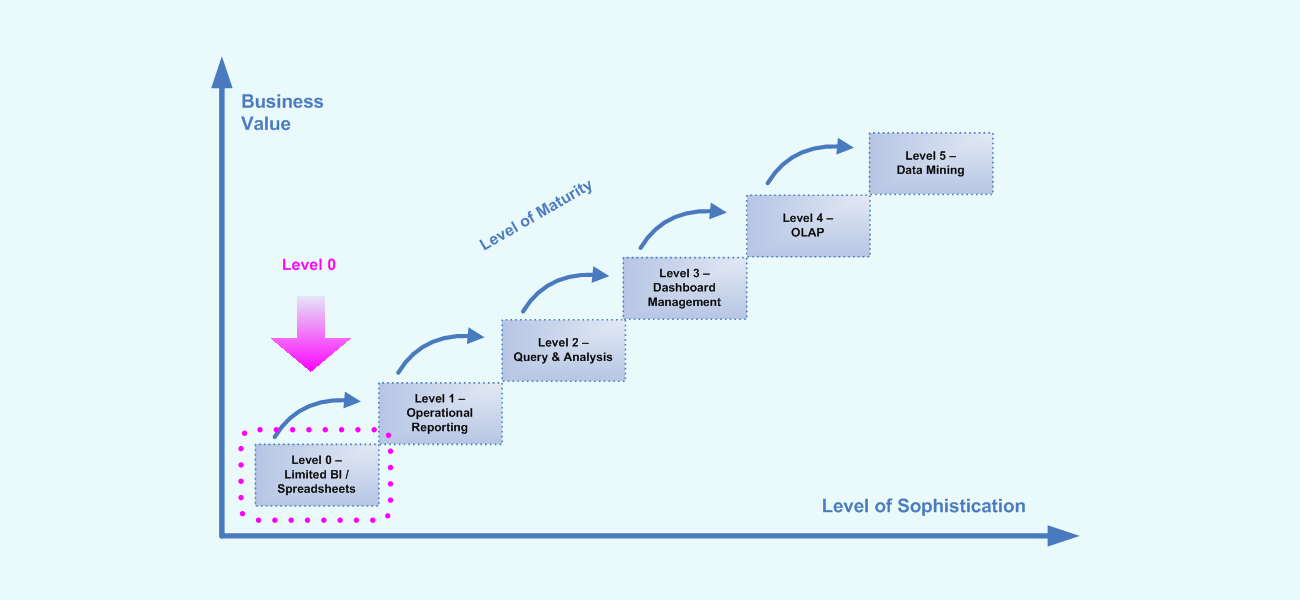
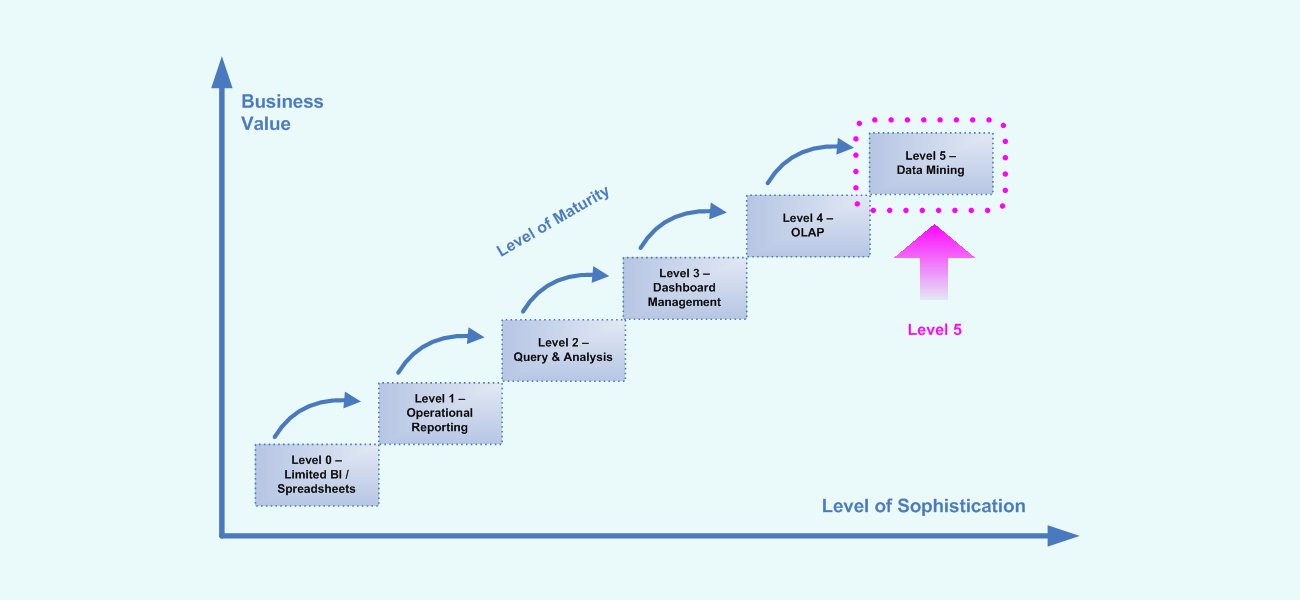
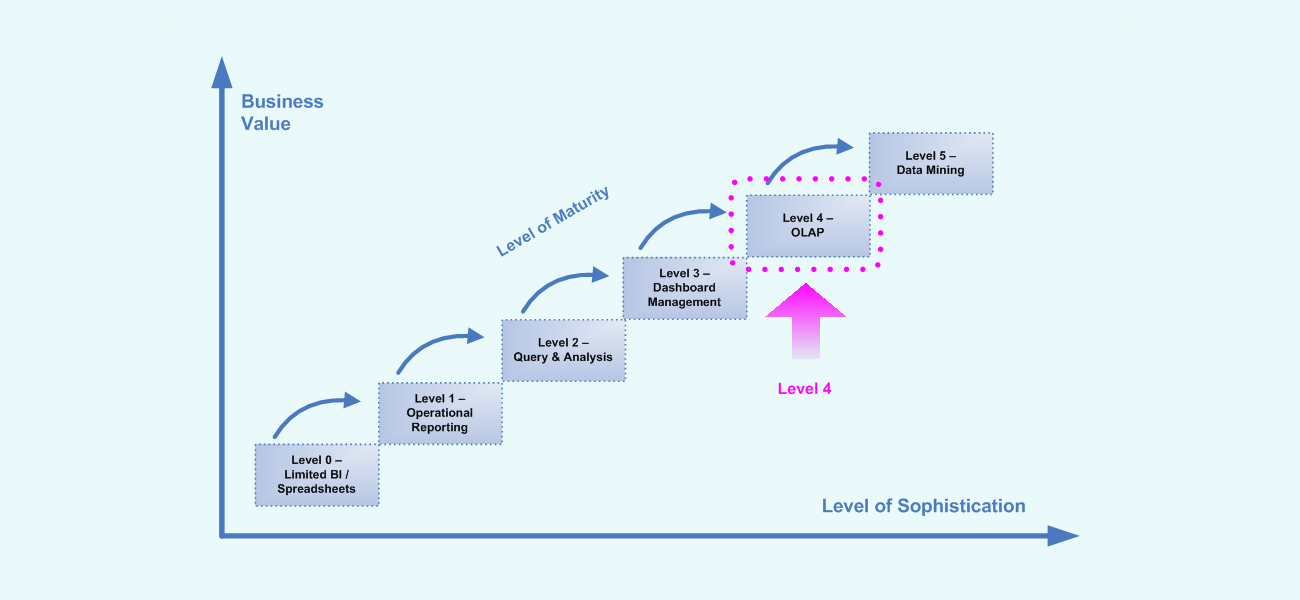
Fundamentally, there are five categories of business intelligence applications…

•  Operational Reports:  Displays data with rich presentation and within a structured layout (i.e. rows and columns).
•  Query and Analysis:  Interactive methods to query data, present data in an ad-hoc manner, and to find information on an as-needed basis.
•  Dashboard Management:  Graphical interfaces and real-time methods to provide guided analysis and to intuitively monitor organizational metrics.
•  On-line Analytical Processing (OLAP):  The capability of manipulating and analyzing data from multiple perspectives in a rapid fashion.
•  Data Mining & Predictive Analytics:  Utilizing statistics, algorithms, and sophisticated data search capabilities to discover hidden patterns and relationships in data and project future results.

Read more

Share

Business Intelligence Vendor Consolidation (2003-2008)

The business intelligence (BI) software marketplace has seen a wave of corporate acquisitions since the mid 1990s with the size and importance of the acquisitions coming to their apex during the years 2003 – 2008. This surge in corporate activity in the mid part of the decade has been characterized by a number of large software companies making major, strategic moves.   Thus the industry is now in a state in which there are clear leaders or as Gartner, Inc puts it, “megavendors” that own a significant control over the over-all market share. In addition the rest of the BI vendors that not have been a part of acquisition activity are smaller organizations and are more commonly referred to as “niche” or “pure-play” vendors.  These “niche” vendors each produce and sell viable business intelligence software products, but they do not encompass the breadth of complimentary technologies that the “megavendor” produces.

Business Intelligence Vendor Consolidation (2003-2008)

BI Vendor Consolidation (2003-2008)

As a result of the BI vendor consolidation of 2003-2008 the following megavendors have placed themselves in a position to control over 2/3 of the business intelligence software marketplace …
•   IBM
•   Microsoft
•   Oracle
•   SAP Business Objects
Share

Business Intelligence Vendors and Products (2010)

As of the end of 2010, the business intelligence (BI) software marketplace is in a state in which there are clear leaders or as Gartner, Inc puts it, “megavendors” that own roughly two-thirds of the $6 billion market.  In addition the rest of the BI vendors are more commonly referred to as “niche” or “pure-play” vendors.  These “niche” vendors each produce and sell viable business intelligence software products, but they do not encompass the breadth of complimentary technologies that the “megavendor” produces.  Regardless of the size of the vendor, both the “megavendors” and “pure-play” vendors do provide very capable and feature-rich software solutions.

Even though many of vendors listed below produce a number of related products, this list is only focused on business intelligence software products.

BI Software Vendors and Products (2010)

BI Software Vendors and Products (2010)

The following companies are currently known as megavendors
• IBM
• Microsoft
• Oracle
• SAP
And the following companies are now known as niche or pure-play vendors
• MicroStrategy
• Information Builders
• Actuate
• LogiXML
• QlikTech
• Pentaho
• Jaspersoft
• Panorama Software
• Tibco Software (Spotfire)
• Tableau Software
• Targit
• arcplan
• Board International
Share

Gartner Evaluates the “Big Four” BI Megavendors

Gartner Logo

Although they’re not pure-play business intelligence vendors, IBM, Microsoft, Oracle Corp., and SAP Business Objects own two-thirds of the $6 billion business intelligence (BI) market because they have optimized their BI platforms to work well with their respective enterprise and information management applications, according to Gartner Inc. This integrated approach, as well as the fact that many enterprises already have these vendors’ ERP and information management applications in place, is swaying customers to standardize on one of their BI platforms. (source: searchcio.com)

Read more

Share
Business Intelligence (BI) Maturity Model - Level 5

BI Maturity Model Level 5 – Data Mining & Predictive Analytics

Overview of Data Mining & Predictive Analytics Concept

According to data-mining-guide.net, data mining is the process of analyzing large data sets in order to find patterns that can help to isolate key variables to build predictive models for management decision making.  In addition, data mining applications help discover hidden patterns and relationships in data in order to effectively project and predict future results. In order to accomplish this goal, data mining applications utilize statistics, algorithms, advanced mathematical techniques, and sophisticated data search capabilities.

Sample Data Mining ApplicationAccording to webopedia.com, predictive analytics is the practice of extracting information from existing data sets in order to determine patterns and predict future outcomes and trends.  Predictive analytics does not tell you what will happen in the future. It forecasts what might happen in the future with an acceptable level of reliability and includes what-if scenarios and risk assessment. Predictive analytics requires a high level of expertise with statistical methods and the ability to build predictive data models. As a result, it’s typically the domain of data scientists, statisticians and other skilled data analysts. The highly skilled analysts are typically supported by data engineers, who help to gather relevant data and prepare it for analysis, and by software developers and business analysts, who help with data visualization, dashboards and reports.

Fundamentally, data mining and predictive analytics tools provide answers to questions that may never have been asked and these tools are effectively able to determine relative amounts of correlation between data elements.  Further, the predictive features of data mining tools enable organizations to exploit useful patterns in data that may have otherwise been difficult to determine.

Characteristics of Data Mining & Predictive Analytics Applications

•  Leverages statistics, advanced techniques, algorithms, and sophisticated data search capabilities
•  Extrapolates past organizational performance
•  Forecasts and predicts future results of the business
•  Provides answers to questions that may never have been asked
•  Calculates levels of correlation between data elements
•  Implementers are experts of statistic analysis and/or processing of large queries
Share
Business Intelligence (BI) Maturity Model - Level 4

BI Maturity Model Level 4 – Online Analytical Processing (OLAP)

Level 4 – On-line Analytical Analysis (OLAP) Systems

On-line analytical processing (OLAP) is a technique for rapidly visualizing and analyzing business metrics across different points of view. OLAP is a term used to generically refer to software and applications that provide users with the ability to store and access data in OLAP cubes (also called a ‘multidimensional cube’ or a hypercube) with this “cube” being made up of numeric facts, called measures, and text values, called dimensions.

Sample On-line Analytical Analysis (OLAP) Application

Moreover, OLAP systems provide users with insight into past performance and they enable a deep understanding of the reasons behind why previous events have occurred. Fundamentally, OLAP systems allow users to rapidly view and analyze data from many perspectives or dimensions and allows the users to conduct advanced “What-If” analysis.

Characteristics of OLAP Applications

•  Retrieves data from OLAP cubes rather than database tables
•  Enables advanced insight into past performance
•  Provides accurate and precise “What-If” analysis
•  Queries perform extremely rapidly
•  Primarily used by business areas concerned with financial and resource planning
Share
Business Intelligence (BI) Maturity Model - Level 3

BI Maturity Model Level 3 – Dashboard Management

Overview of Dashboard Management

Dashboard management systems are intended to facilitate and support the information and decision-making needs of management by providing easy access to key business information in a highly graphical and intuitive format. Fundamentally, a dashboard is a graphical business tool that displays a set of KPIs (key performance indicators), metrics, and any other relevant information to a business user, manager, or key decision-maker in a single consolidated view and allows for organizational performance to be easily measured and monitored.  Dashboard data is often displayed as aggregate information and contains data that consolidated from multiple data sources scattered throughout an organization. Dashboards are commonly interactive and provide users the ability to drill into particular aspects of the display and/or rapidly switch between views of the data.

Sample Organizational Dashboard

To make this possible, dashboards are typically composed of advanced data visualization tools including charts, grids, gauges, and maps that allow for various ways of presenting information and interacting with the data. Moreover, dashboard management environments are characterized by providing users with graphical methods to view and interact with key data elements and get a snapshot of organizational performance.

Characteristics of Dashboard Management

•  Presents a number of organizational metrics in a single consolidated view
•  Presents data in graphical and intuitive format
•  Utilizes graphics, charts, grids, gauges, and maps
•  Monitors organizational metrics and key performance indicators (KPI)
•  Enables real-time visibility into data
•  Primarily utilized by senior management and key decision-makers
•  Rapidly displays a snapshot of organizational performance
Share
Business Intelligence (BI) Maturity Model - Level 2

BI Maturity Model Level 2 – Query & Analysis

Overview of Query & Analysis Solutions & Environments

Sample Query and Analysis Solution

Sample Query and Analysis Solution

Query and analysis solutions enable business users and analysts to rapidly generate business queries and reports from enterprise data based upon business question of the data.  Also known as “ad-hoc” querying, these tools typically provide intuitive, graphical interfaces that shields users from technical complexities and allows users to leverage business terminology instead of the more technical database names. The business focus of these tools allows nontechnical professionals to be comfortable with their data and allows them to quickly and efficiently satisfy their own information needsin real time with minimal assistance from system developers. Commonly, query and analysis environments include a middleware layer that converts database conventions into business nomenclature that is more intuitive and understanding to end-users. Moreover, query & analysis environments give users the capability to access and analyze data in a unique and personal manner. Utilized primarily by business users, query and analysis solutions provide an environment that enables interactive methods to query data, present data in an ad-hoc manner, and find information on an as-needed basis.


Characteristics of Query & Analysis Environments

•  Utilized primarily by business users
•  Drag-n-drop interfaces to create queries and simple reports
•  Rapidly and intuitively generate queries with minimal help from IT professionals
•  Highly-interactive methods to query data
•  Users ask business questions to develop queries
•  To produce queries, users only need to understand their own business terms
•  Users can independently dive into the details of their data
Share
Business Intelligence (BI) Maturity Model - Level 1

BI Maturity Model Level 1 – Operational Reports

Overview of Operational Reports

Operational reports are pre-designed business reports that focus on listings of data at the detailed level with data presented within a highly-structured format.  Also known as “canned reports”, operational reports enable organizations to present data in a logical format and are designed to support the day-to-day activities of an organization at the transaction level. They are typically developed by information technology (IT) departments and/or advanced report users that have a good understanding of reporting tools, business rules, and database concepts.  In addition, operational reports can be scheduled, refreshed, and distributed on a regular basis.  Fundamentally operational reports are used by people with the responsibility for improving their organization’s operations.

Sample Operational Report

Sample Operational Report

The tools provide task-oriented line-item information on individual transactions at the granular level of detail.  Operational reports are ideal for printing and displaying lists of detailed records or transactions in richly-formatted manner.

Characteristics of Operational Reports

•  Presents data in a logical format
•  Data is distributed in a highly-formatted manner
•  Reports can be published on a regular schedule
•  Distribution of organized listings of data
•  Enables users to understand transactional and/or detail level data
•  Typically developed by information technology (IT) personnel and/or knowledgeable power users

Read more

Share
Business Intelligence (BI) Maturity Model - Level 0

BI Maturity Model Level 0 – Spreadsheets

Overview of Spreadsheets

A spreadsheet is a computer application that simulates a paper, accounting worksheet. It displays multiple cells that together make up a grid consisting of rows and columns, each cell containing alphanumeric text, numeric values or formulas.  Because spreadsheets are easy to work with and are widely available, many businesses rely on them to take the place of a more sophisticated business intelligence tool.  Instead of providing a consistent view of the organizational data, spreadsheets have decentralized views of limited amounts of data. In addition, spreadsheets are typically developed by an individual user, consist of little or no organizational standards, and encompass limited system analysis and quality assurance before being used as an official reporting source.

Example Spreadsheet

Example Spreadsheet

It is typically up to the spreadsheet developer to decide what metrics are important, what data needs to be included, how the data is formatted, and what level of aggregation is necessary.  Spreadsheets become isolated and inconsistent data silos, and are difficult for analysts to extract, transform and load data into a central database to be interpreted at an enterprise level.


Characteristics of Spreadsheets

•  Widely used personal desktop application / available on most user workstations
•  Reporting of data conducted in rows and columns
•  High degree of individual use and high degree of inaccuracy and variability
•  Limited security and limited collaboration capabilities built into software environments
Share