Posts

Business Intelligence Capability – Data Visualization

Overview of Data Visualization Solutions

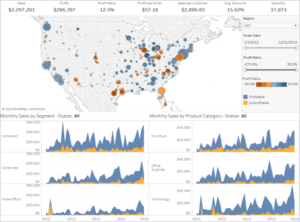
Data Visualization Solutions enable analysis by providing highly-graphical representations of information and data. By using visual elements including charts, graphs, and maps, data visualization is an accessible way to see and understand trends, outliers, and patterns in data. Further, data visualization refers to the techniques used to communicate data or information by encoding it as visual objects contained within graphics.

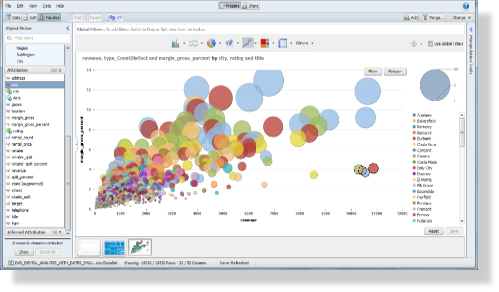
Data visualization tools go beyond the display of basic charts and graphs. Moreover, they display data in more sophisticated ways such as geographic maps, infographics, dials, gauges, sparklines, heat maps, networks, graphs, and charts. The images may include interactive capabilities, enabling users to manipulate them or drill into the data for querying and analysis.  Additionally, numerical data may be encoded within graphics using dots, lines, circles, bubbles, or bars, to visually communicate a quantitative message. Indicators designed to alert users when data has been updated or predefined conditions occur can also be included.  Because of the way the human brain processes information, using graphics to visualize large amounts of data is for more effective for rapid analysis then just looking at data within queries and reports.  Effective data visualization assists users to analyze and reason about data and to draw conclusions. These types of analytical tools make complex data sets more intuitive, understandable, and usable for decision-making.

Characteristics of Data Visualization Solutions

•  Highly graphical presentation of data.
•  Intuitive user interface with visual presentation of data.
•  Rapid comprehension of data.
•  Comparison of different pieces of data.
•  Ease of interpretation of data.
•  Quantitative evaluation of data.
•  Presents numerous numerical metrics in a relatively small space.
•  Numerical data encoded within graphics using dots, lines, circles, bubbles, or bars.
•  Reveals data at several levels of detail and perspectives.
•  Indication of data relationships, patterns, and outliers.
•  Makes large data sets coherent.
•  Enables analysis of trends.
•  Identification of data indicators.
•  Conversion of data into information.

Share

Components of SAP BusinessObjects: Explorer

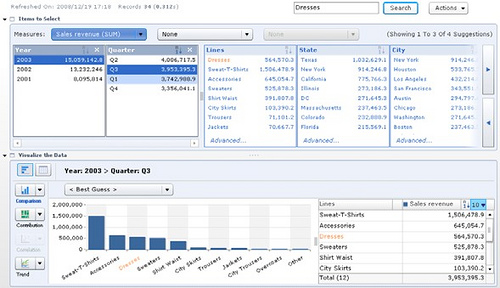
BusinessObjects Explorer is a relatively new component of the SAP BusinessObjects product suite that provides a more advanced and intuitive data exploration interface for business intelligence end-users, both casual and power users.  Explorer encompasses the simplicity and speed of web-search technologies with the trust and analytical power of conventional business intelligence technologies to provide deep understanding and immediate answers to both simple and sophisticated business questions.  BusinessObjects Explorer provides end-users with the capability of quickly exploring and visualizing large data sets.  Features includes searching and sorting, interactive drilldowns, and various types of dynamic graphical visualizations while navigating through corporate data.

SAP BusinessObjects Explorer

Features and Functions of BusinessObjects Explorer

Robust Search Capability
• Search Experience Similar to Google or Yahoo – Users enter keywords to find instant business information with return results ranked by relevance.
• Search Concurrent Data Sources – Reach data across an entire SAP BusinessObjects landscape and any data source that it accesses.
• Self-Service Access – Pervasive searches with queries directly to data without the need for a predefined report or query.
Trust and Power of a Conventional Business Intelligence System
• Guided Data Exploration – The most relevant keyword search results are presented first, allowing end-users to access additional contextually relevant details as they explore.
• Intuitive Visualization – The system automatically generates charts and grapchs that best represents the information being queries – no cryptic data model or data knowledge is required by any end-user.
• Team Collaboration – Share information easily via e-mail, embedded URL, and other popular communication formats.
Ease of Deployment to End-Users
• Leverages Existing BusinessObjects Infrastructure – Reuses existing universes, security, and administration services already deployed within the BusinessObjects platform.
• Limited End-User Training Required – Intuitive end-user interface and functionality allows first-time users to get started with next-to-no formal training.
• Rapid Implementation Schedule – Add search, exploration, and visualization functionality to an existing BusinessObjects deployment in as little as a few days.
Share