Posts

Primary Components of Business Intelligence Systems

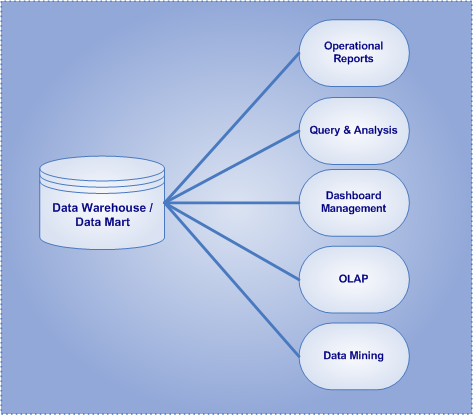
Business Intelligence (BI) systems are software applications that enable better understanding of organizational data and provide the information organizations need to make enlightened decisions. Moreover, business intelligence systems are primarily focused on reporting, querying, and analysis of data residing in an enterprise data warehouse (EDW), and both dependent and independent data marts.

Primary Components of Business Intelligence (BI)

Primary Components of Business Intelligence (BI)

Fundamentally, there are five categories of business intelligence applications…

•  Operational Reports:  Displays data with rich presentation and within a structured layout (i.e. rows and columns).
•  Query and Analysis:  Interactive methods to query data, present data in an ad-hoc manner, and to find information on an as-needed basis.
•  Dashboard Management:  Graphical interfaces and real-time methods to provide guided analysis and to intuitively monitor organizational metrics.
•  On-line Analytical Processing (OLAP):  The capability of manipulating and analyzing data from multiple perspectives in a rapid fashion.
•  Data Mining & Predictive Analytics:  Utilizing statistics, algorithms, and sophisticated data search capabilities to discover hidden patterns and relationships in data and project future results.

Read more

Share
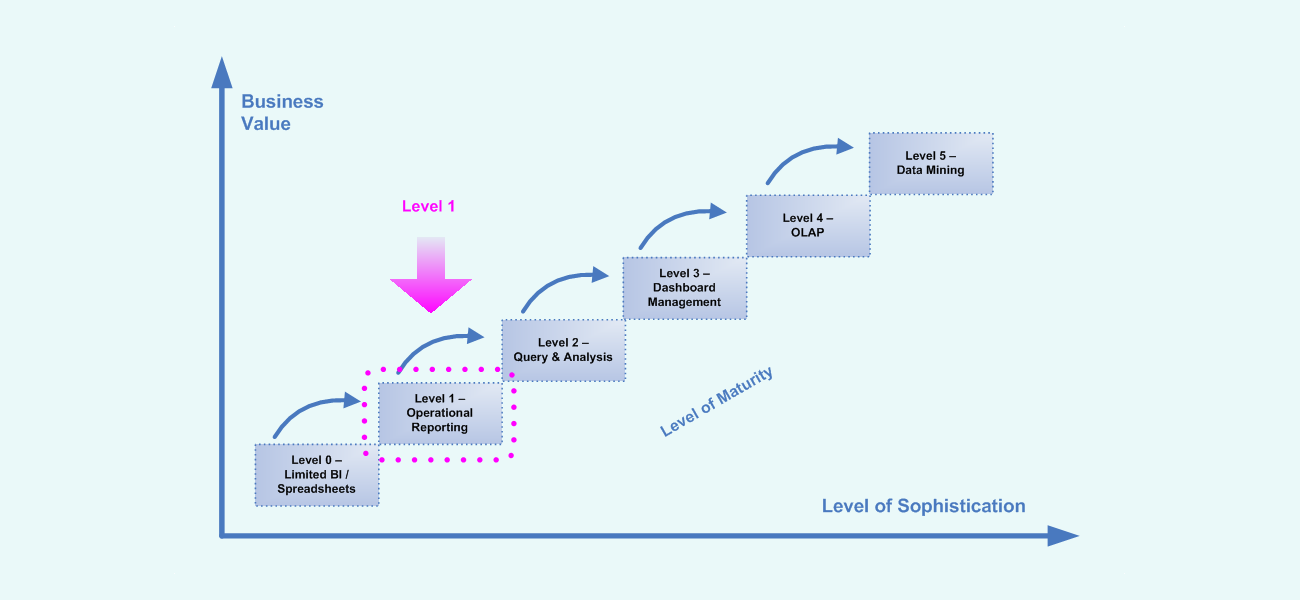
Business Intelligence (BI) Maturity Model - Level 1

BI Maturity Model Level 1 – Operational Reports

Overview of Operational Reports

Operational reports are pre-designed business reports that focus on listings of data at the detailed level with data presented within a highly-structured format.  Also known as “canned reports”, operational reports enable organizations to present data in a logical format and are designed to support the day-to-day activities of an organization at the transaction level. They are typically developed by information technology (IT) departments and/or advanced report users that have a good understanding of reporting tools, business rules, and database concepts.  In addition, operational reports can be scheduled, refreshed, and distributed on a regular basis.  Fundamentally operational reports are used by people with the responsibility for improving their organization’s operations.

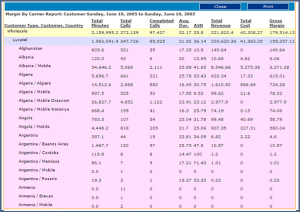
Sample Operational Report

Sample Operational Report

The tools provide task-oriented line-item information on individual transactions at the granular level of detail.  Operational reports are ideal for printing and displaying lists of detailed records or transactions in richly-formatted manner.

Characteristics of Operational Reports

•  Presents data in a logical format
•  Data is distributed in a highly-formatted manner
•  Reports can be published on a regular schedule
•  Distribution of organized listings of data
•  Enables users to understand transactional and/or detail level data
•  Typically developed by information technology (IT) personnel and/or knowledgeable power users

Read more

Share
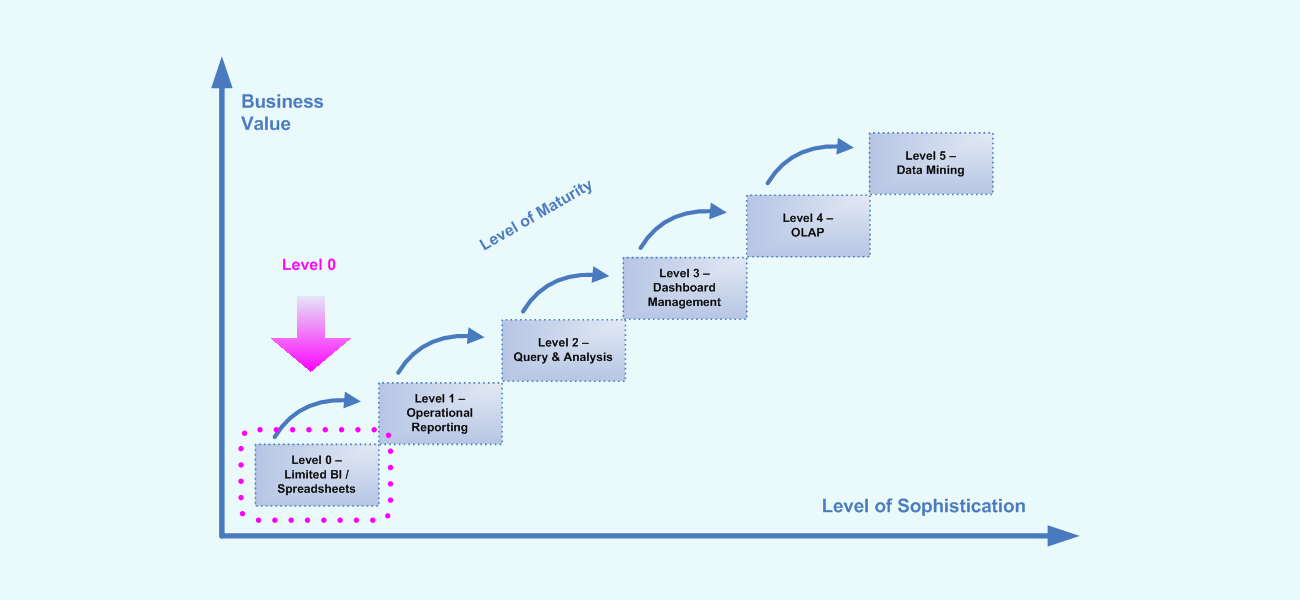
Business Intelligence (BI) Maturity Model - Level 0

BI Maturity Model Level 0 – Spreadsheets

Overview of Spreadsheets

A spreadsheet is a computer application that simulates a paper, accounting worksheet. It displays multiple cells that together make up a grid consisting of rows and columns, each cell containing alphanumeric text, numeric values or formulas.  Because spreadsheets are easy to work with and are widely available, many businesses rely on them to take the place of a more sophisticated business intelligence tool.  Instead of providing a consistent view of the organizational data, spreadsheets have decentralized views of limited amounts of data. In addition, spreadsheets are typically developed by an individual user, consist of little or no organizational standards, and encompass limited system analysis and quality assurance before being used as an official reporting source.

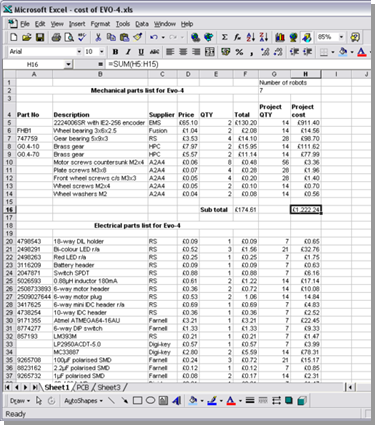
Example Spreadsheet

Example Spreadsheet

It is typically up to the spreadsheet developer to decide what metrics are important, what data needs to be included, how the data is formatted, and what level of aggregation is necessary.  Spreadsheets become isolated and inconsistent data silos, and are difficult for analysts to extract, transform and load data into a central database to be interpreted at an enterprise level.


Characteristics of Spreadsheets

•  Widely used personal desktop application / available on most user workstations
•  Reporting of data conducted in rows and columns
•  High degree of individual use and high degree of inaccuracy and variability
•  Limited security and limited collaboration capabilities built into software environments
Share