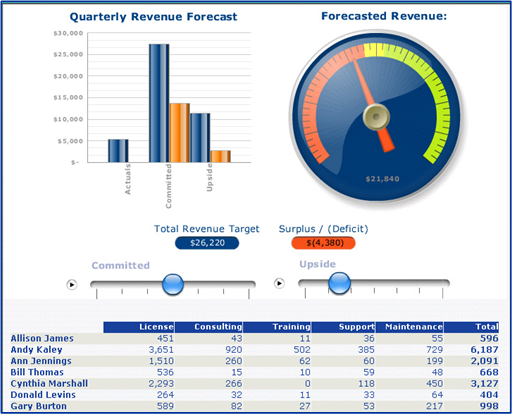
Xcelsius is the primary dashboard development tool of the SAP BusinessObjects suite of business intelligence products. Xcelsius extends the power of business intelligence environments by offering interactive devices including gauges, charts, widgets, drop-down menus, and sliders. These intuitive and user-friendly devices simplify the display of complex business data and provide decision makers with an easy way to interact with data and test out future business scenarios with the click of a mouse.
-

Sample Xcelsius Dashboard
- At its heart, Xcelsius is a dynamic and customizable data visualization software package that enables development of both insightful and engaging dashboards from various data sources throughout a typical organization. Moreover, Xcelsius includes graphical interfaces and real-time methods that provide guided analysis and for dynamic monitoring of organizational metrics and key performance indicators (KPIs).
Key Features of Xcelsius Dashboards Include:
- • Intuitive graphical visualizations of data.
- • Dashboard customization to meet unique business needs.
- • Connection of dashboards to any type of data source.
- • Maximization of the value of a business intelligence solution with rich user interface.
- • Deployment of dashboards within Microsoft Office, Adobe PDF, Portals, or on the Web.
- • Empowerment of decision-makers to view and understand key organizational metrics.
- • Improved user adoption of BI tools because of business-friendly visualizations.


