Posts

BI Market: Dashboard Management (Vendors and Products) – 2011

Dashboard management systems are intended to facilitate and support the information and decision-making needs of management by providing easy access to key business information in a highly graphical and intuitive format. Fundamentally, a dashboard is a graphical business tool that displays a set of KPIs (key performance indicators), metrics, and any other relevant information to a business user, manager, or key decision-maker in a single consolidated view and allows for organizational performance to be easily measured and monitored.  Dashboard data is often displayed as aggregate information and contains data that consolidated from multiple data sources scattered throughout an organization. Dashboards are commonly interactive and provide users users the ability to drill into particular aspects of the display and/or rapidly switch between views of the data.

In 2011, the market leading vendors for dashboard management systems include: SAP Business Objects, Oracle, IBM Cognos, MicroStrategy, Microsoft, SAS, QlikTech, LogiXML, Corda, Dundas, iDashboards, Pentaho, & Jaspersoft.

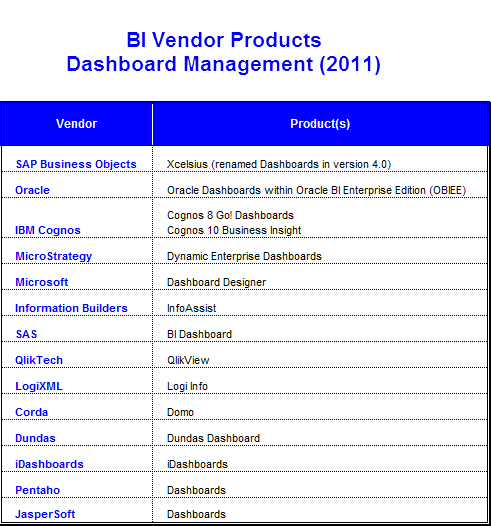
BI Vendor Products - Dashboard Management (2011)

Share

Components of Oracle BI Enterprise Edition (OBIEE) – Oracle Interactive Dashboards

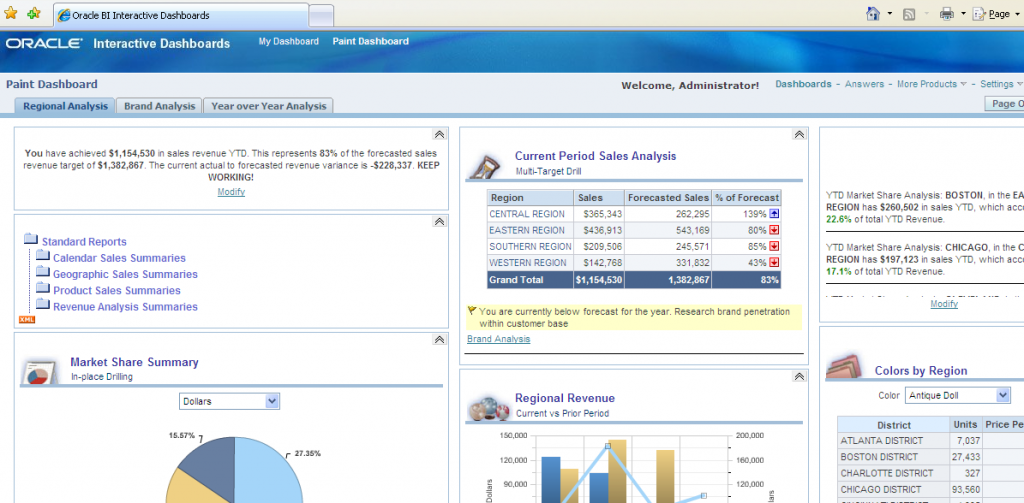
Oracle Interactive Dashboards is a presentation component of the Oracle Business Intelligence Enterprise Edition (OBIEE) suite and provides versatile, web-based dashboards that displays information in a highly-intuitive format to help end-users’ decision making.  The user interface is completely graphical while access to the information is interactive and based on the individual’s role and identity. Further, the user has full capability for modifying and interacting with data utilizing the following controls …
• Live reports
• Charts
• Tables
• Prompts
• Pivot tables

Additionally, the Oracle Interactive Dashboards provides the user with full capability of drilling, navigating, modifying, and interacting with data sets. This concept is commonly referred to as “guided analysis“.  Oracle Interactive Dashboards can retrieve and aggregate content from a wide variety of sources, including the traditional databases, data warehouses and data marts, shared file servers, and document repositories.

OracleBI - Dashboards

Oracle Interactive Dashboards provide personalized views of corporate and external information. A dashboard consists of one or more pages, which appear as tabs across the top of the dashboard. Pages can display anything that you can access or open with your Web browser, such as saved queries and requests, alerts from Oracle Delivers, images, charts, tables, text, and links to Web sites and documents.

Share