Posts

Data Vault Data Model for EDW

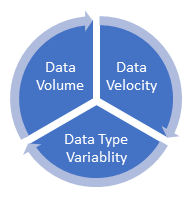
The Data Vault data model provides an evolution in the way that enterprise data warehouses (EDW) are designed, constructed, and deployed. Moreover, Data Vault provides a new and powerful way to model data within an enterprise data warehouse (EDW) that is more scalable, extensible, and auditible than conventional modeling techniques. It is an ideal modeling technique for EDW that either have a large volume of data, a large number of disparate data sources, a high degree of variety in the ingested data, or a large number of diverse information consumers. Fundamentally, the Data Vault is a hybrid data modeling technique that provides historical data representation from multiple sources designed to be resilient to environmental changes.

The Data Vault model provides a method of looking at historical data that deals with issues such as auditing, tracing of data, loading speed and resilience to change as well as emphasizing the need to trace where all the data in the database came from. This means that every row in a data vault is accompanied by record source and load date attributes, enabling an auditor to trace values back to the source.

According to Dan Linstedt, creator of Data Vault data modeling, Data Vault is defined as:

The data vault is a detail oriented, historical tracking and uniquely linked set of normalized tables that support one or more functional areas of business. it is a hybrid approach encompassing the best of breed between 3rd normal form (3nf) and star schema. the design is flexible, scalable, consistent and adaptable to the needs of the enterprise. it is a data model that is architected specifically to meet the needs of today’s enterprise data warehouses.

Data Vault Tables

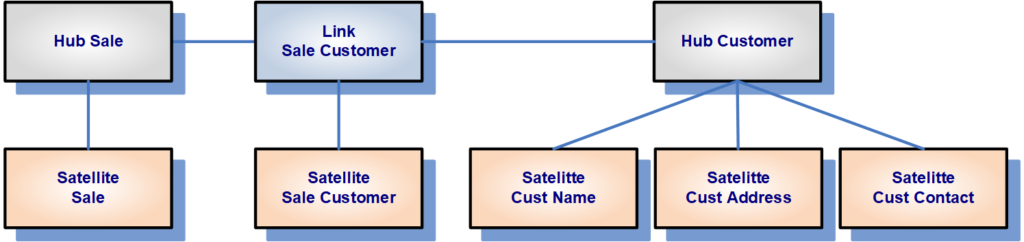
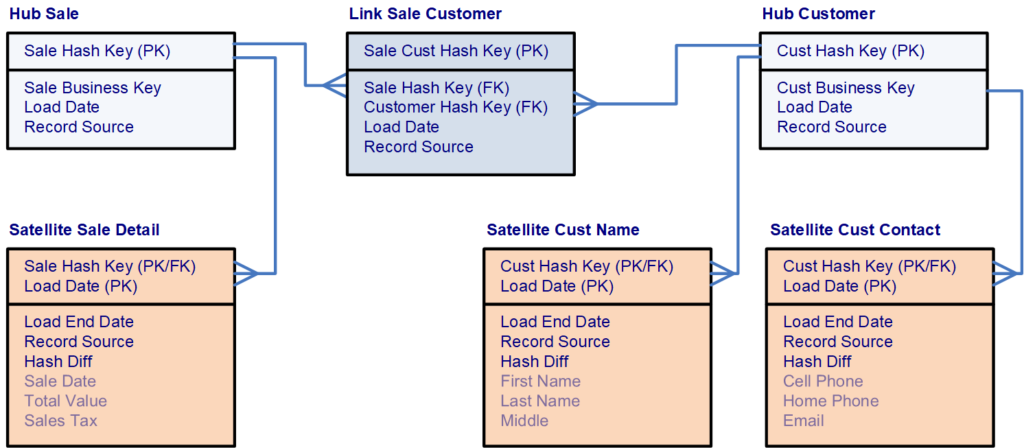
The Data Vault model is based upon three distinct table types which each table type serving a specific purpose:

•  Hub tables store a unique field for each business entity known as business key.
•  Link tables store relationships between hub tables.
•  Satellite tables store the attributes of the business key.

Hub Table:
Consists of a list of unique business keys that represent a distinct way of identifying a business element as well as fields that describe the origin of the record. Additionally hub tables cannot contain any foreign key fields. Types of fields included in the hub table are:

1) Hash Key which serves as the primary key of the hub table in a hash format.
2) Load Date which includes the date time that the record was inserted into the hub table.
3) Record Source which includes the name of the data source from where the record originated.
4) Business Key which is the unique identifier of the business entity as a either a text or number value and can be more than one field in the table.

Link Table:
Establishes relationships between business keys, contains foreign keys to hub tables, and includes fields about the relationship. A link table is therefore an intersection of business keys and contains the fields that represent the business keys from the related hub tables. The purpose of the link table is to capture and record the relationship of data elements at the lowest possible level of granularity. And a link table must have relationship with at least two hub tables. Types of fields included in link table are:

1) Hash Key which serves as the primary key of the link table in a hash format.
2) Foreign Keys which provide references to the primary hash key of related hub tables.
3) Business Keys which provide a copy of the business key value from the related hub tables.
4) Load Date which includes the date time that the record was inserted into the link table.
5) Record Source which includes the name of the data source from where the record originated.

Satellite Table:
Comprised of all the fields that describe a business entity or relationship and provide context at a given time or over a time period to either a hub or link. Satellite tables consist of foreign keys linking them to a parent hub table or link table, fields that describe the origin of the record, as well as a start and end dates fields. The structure and concept of a
satellite table is very much like a type 2 slowly changing dimension in a dimensional model. History of changes is stored within a
satellite table as well as change data capture (CDC) is conducted within a satellite table. Types of fields included in the satellite table are:

1) Parent Hash Key which provides a foreign key reference to a hub table and is one of two fields included in the primary key of the table.
2) Start Date which indicates the date and time that the satellite record starts being active and is the second of two fields included in the primary key of the table.
3) Record Source which includes the name of the data source from where the record originated.
4) Load End Date which indicates the date and time that the satellite record became inactive.
5) Extract Date which indicates the date and time that the records was extracted from the source system.
6) Hash Diff which is a hash value of all of the descriptive values of a record.
7) Descriptive Fields which are any fields that provide more detail about the entity.

Business Keys and Hash Keys

Business Key: A text value that must be a declared unique or alternate key constraint within the hub table. This means that only one distinct value can exist within the entire Hub table. The business key does not necessarily have to be just one field within the hub table. It can be a compound key made up of more than one column. Business keys are also included as non-unique fields within link tables. True business keys are not tied to any one source system and could be contained within multiple source systems. Examples of typical business keys include: account number, product code, customer number, employee id, invoice number, and order number.

Hash Key:  One of the innovations within the latest version of the Data Vault model is the replacement of standard integer primary keys or surrogate keys with hash-based primary keys. This feature of the Data Vault model enables a Data Vault solution to be deployed either on a relational data management system (RDBMS) or on Hadoop systems. Hadoop systems do not have surrogate key generators like an RDBMS, but a unique MD5 hash value can be generated in Hadoop. With a hash key being used in Hadoop and a hash key being used in an RDBMS, tables can be logically joined.

Data Vault and Information Marts

The Data Vault layer within an EDW is normally used to store data and data is never deleted from the data vault unless there is a technical error while loading data. Additionally the Data Vault layer is not optimized for business intelligence and analytical use. Dimensional modeling is much more suited for this purpose. Subsequently, information marts contain dimensional models and are the source for data analytics. In order to be used by end-users, data contained in the data vault needs to be converted to a dimensional model and moved into related information marts. Dimension tables in information marts will then be sourced from data vault hub and related satellite tables. While fact tables in information marts will be sourced from data vault link and related satellite tables. Upon data being converted into dimensional models and moved into information marts, business intelligence tools including SAP Business Objects, Cognos, OBIEE, Tableau, SSAS, Power BI, & Qlik Sense can be used by end-users to conduct analytics on the data.

Summary

The best use for the Data Vault data model is within the enterprise data warehouse (EDW) of a complete business intelligence environment. Moreover, the Data Vault model is specifically designed for this purpose. And the Data Vault model is the ideal data modeling technique for databases that store large volumes of highly volatile data, contain a high degree of data variety, and contain data from multiple disparate sources.

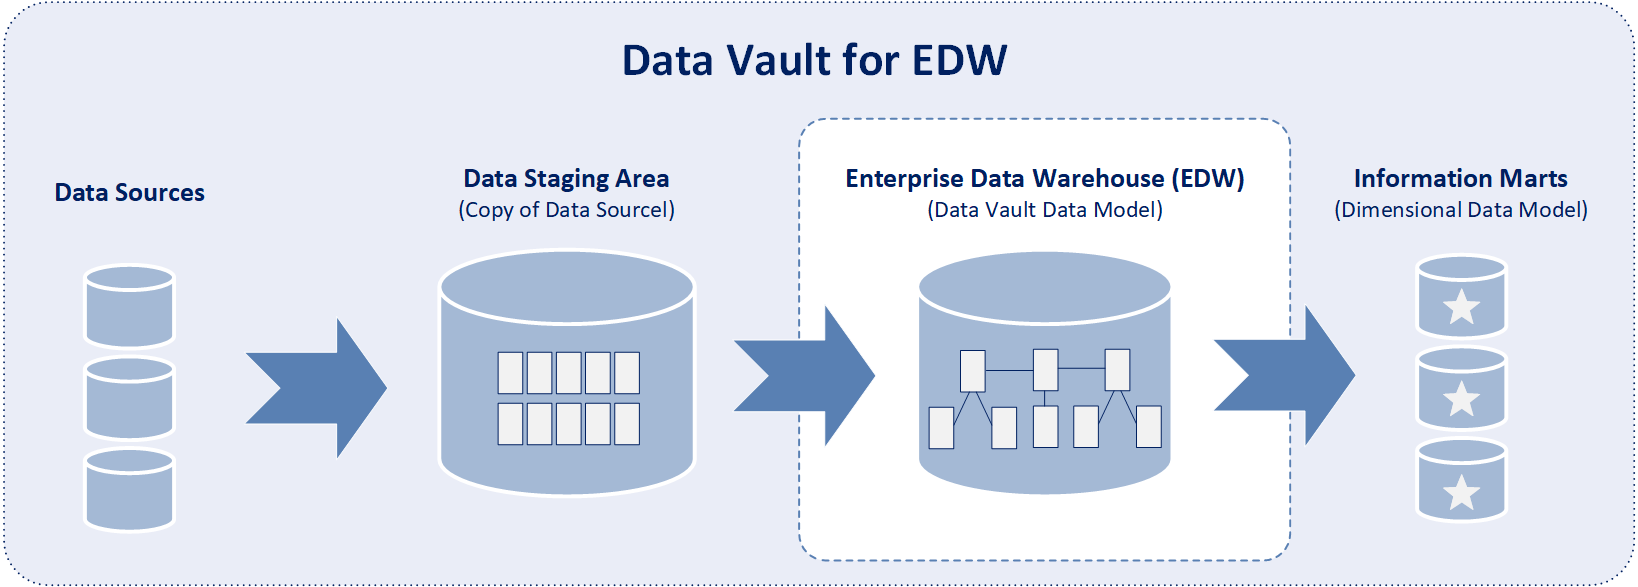
However, the Data Vault model is only one part of the complete Data Vault architecture which contains three layers:

1) Data Staging Area which contains a copy of source data.
2) EDW which is designed using the Data Vault model.
3) Information Marts which are designed using a dimensional model are the source of data for end-user analysis.

Share

Business Rationale, Core Themes, & Misconceptions of NoSQL

Business Rationale for NoSQL

According to the book, “Making Sense of NoSQL”, by Dan McCreary and Ann Kelly, increases of data volume, data velocity, and data type variability within modern business organizations has created a high demand on conventional relational database management systems (RDBMS) and requires a new paradigm for organizations to remain effective. Organizations have been realizing that they now need to rapidly capture and analyze immensely large amounts of changing data that is being received in many different formats. Data volume and data velocity refer to the ability to process large data sets as they rapidly arrive. Data type variability refers to diversity in data types that don’t easily fit into structured database tables.

•  Data Volume:  Volume refers to the incredible amounts of data generated each second from social media, email, message, text documents, smart phones, sensors, photographs, video, etc. The vast amounts of data have become so large in fact that the data can no longer be stored and analyzed using traditional database technology. Now that data is generated by machines, networks, and human interaction, the amount of data to be analyzed is massive. We now use distributed systems, where parts of the data are stored in different locations and brought together by software. Collecting and analyzing this data is clearly an engineering challenge of immensely vast proportions. More sources of data with a larger size of data combine to increase the amount of data that must be analyzed. This is a major issue for those organizations looking to put that data to use instead of letting it just disappear.

•  Data Velocity:  Velocity refers to the speed at which vast amounts of data are being generated, collected and analyzed. Additional, velocity deals with the pace at which data flows in from sources like business processes, machines, networks and human interaction. And the flow of data is both continuous and massive in amount. Real-time data can help researchers and businesses make valuable & timely decisions that provide both strategic and competitive advantages, as well as a high return on investment (ROI). Not only must the data be rapidly analyzed, but the speed of transmission, and access to the data must also remain instantaneous. In the past, companies analyzed data using long-running batch processes. That paradigm worked well when the incoming data rate was slower than the batch processing rate and when the result was useful despite the delay in analysis execution. With new sources of data such as social, web, and mobile applications, the batch process paradigm has broken down. Now data is now streaming into servers in a real-time, continuous fashion and the result is only useful if data is immediately analyzed with very little delay.

•  Data Type Variability:  Variability refers to the many sources and types of data both structured and unstructured. In the past, data was managed primarily within spreadsheets and relational databases. Now data comes in the form of emails, text, photo, audio, video, web, GPS data, sensor data, relational databases, documents, messages, pdf, flash, etc. Data structures have changed to lose its rigid structure and hundreds of data formats are now being implemented. Organizations no longer have control over the input data format. Structure can no longer be imposed like in the past in order to keep control over the analysis. Organizations that want to capture and report on exception data struggle when attempting to use rigid database schema structures imposed by traditional relational database management systems. More and more, data being created and being analyzed is of the unstructured variety. New and innovative technologies are now allowing both structured and unstructured data to be harvested, stored, and processed simultaneously.


Core Themes of NoSQL Databases

•  Multiple data formats:  NoSQL databases store and retrieve data from many formats: key-value stores, graph stores, wide column / column family stores, document stores, & search engines.
•  Free of table joins:  NoSQL databases allow for extraction of data using simple interfaces without the use of joins between tables.
•  Free of pre-defined schema:  NoSQL databases allow users to place data into a file folder and then query the data without defining a data schema.
•  Distributed processing:  NoSQL databases can use more than one or multiple computer processors in order to execute.
•  Horizontal scaling / scaling out:  NoSQL databases have direct increases of system performance with the addition of computer processors.
•  Design alternatives:  NoSQL databases offer multiple options to a traditional single method of storing, retrieving, and manipulating data.
•  High performance:  NoSQL database are optimized for specific data models and access patterns that enable higher performance than trying to accomplish similar functionality with relational databases.
•  Rapid implementations:  NoSQL databases generally provide flexible data schema that enable faster and more iterative development.


Common Misconceptions of NoSQL Databases

•  NoSQL is all not about the SQL query language:  NoSQL databases are not applications that utilize a language other than SQL. SQL as well as other query languages are used with NoSQL databases.
•  NoSQL is not all about open source projects:  Although many NoSQL database are built upon an open source model, commercial products use NoSQL concepts as well as open source initiatives.
•  NoSQL is not only used in big data projects:  Many NoSQL databases are driven by the inability of an application to efficiently scale when big data is utilized. While data volume and data velocity are important to NoSQL database implementations, NoSQL databases also focus on data type variability and the ability to rapidly implement solutions.
•  NoSQL is not only used in cloud environments:  NMany NoSQL databases do reside in cloud environments to take advantage of the cloud’s ability to rapidly scale. But NoSQL databases can run in both the cloud as well as on-premise data centers.
•  NoSQL is not all about a clever use of memory and SSD:  Many NoSQL databases do focus on the efficient use of computer memory and/or solid-state disks (SSD) to increase performance. While important, NoSQL databases can run on standard commodity hardware.
•  Design alternatives:  NoSQL databases offer multiple options to a traditional single method of storing, retrieving, and manipulating data.
•  NoSQL is not just a few products:  More and more NoSQL databases are constantly being developed. And existing NoSQL databases are constantly being enhanced to included additional functionality.
•  NoSQL databases are not just about solving one problem:  While many NoSQL databases have only been developed using one type of database model, many other NoSQL databases are multi-modal and can solve multiple types of problems.


Share

Business Intelligence Capability – Data Exploration

Overview of Data Exploration Solutions

Data Exploration Solutions enable robust visual searches of vast amounts of data and are commonly used by data analysts.

Data Exploration Solutions include sophisticated data discovery capabilities that enable users to rapidly and intuitively search through large amounts of data in order to gain insights.  Subsequently data exploration solutions enable users to quickly retrieve answers about organizational data and enable users to quickly generate information about the data.  In addition data exploration solutions provide informative search capabilities in order to enable analysis of the available data and enable conversion of the data into information.  While data exploration solutions do enable queries of data, the data is exposed to users using business terminology and underlying database structures and data models are hidden to the user.

SAP BusinessObjects Explorer

Characteristics of Data Exploration Solutions

•  Rapid searches of large data sets
•  Sophisticated data discovery capabilities
•  Intuitive user interface with keyword searches
•  Filtering of data from multiple dimensions or perspectives
•  Drill-down, drill-up capabilities
•  Visualization of data in multiple formats
•  Integration with central databases and data warehouses
•  Guided discovery of data with contextual navigation
•  Abstraction of underlying database and data models
•  Conversion of data into information

Share

Types of Enterprise Data (Transactional, Analytical, Master)

All business enterprises have three varieties of physical data located within their numerous information systems.  These varieties of data are characterized by their data types and their purpose within the organization.
• Transactional Data
• Analytical Data
• Master Data

Data Element Types

Transactional data supports the daily operations of an organization (i.e. describes business events). Analytical data supports decision-making, reporting, query, and analysis (i.e. describes business performance). While master data represents the key business entities upon which transactions are executed and the dimensions around which analysis is conducted (i.e. describes key business entities).

Transactional Data

Transactional data are the elements that support the on-going operations of an organization and are included in the application systems that automate key business processes. This can include areas such as sales, service, order management, manufacturing, purchasing, billing, accounts receivable and accounts payable. Commonly, transactional data refers to the data that is created and updated within the operational systems.  Examples of  transactional data included the time, place, price,discount, payment methods, etc. used at the point of sale. Transactional data is normally stored within normalized tables within Online Transaction Processing (OLTP) systems and are designed for integrity.  Rather than being the objects of a transaction such as customer or product, transactional data is the describing data including time and numeric values.

Analytical Data

Analytical data are the numerical values, metrics, and measurements that provide business intelligence and support organizational decision making. Typically analytical data is stored in Online Analytical Processing (OLAP) repositories optimized for decision support, such as enterprise data warehouses and department data marts. Analytical data is characterized as being the facts and numerical values in a dimensional model. Normally, the data resides in fact tables surrounded by key dimensions such as customer, product, account, location, and date/time. However, analytical data are defined as the numerical measurements rather than being the describing data.

Master Data

Master data is usually considered to play a key role in the core operation of a business. Moreover, master data refers to the key organizational entities that are used by several functional groups and are typically stored in different data systems across an organization.  Additionally, master data represents the business entities around which the organization’s business transactions are executed and the primary elements around which analytics are conducted. Master data is typically persistent, non-transactional data utilized by multiple systems that defines the primary business entities. Master data may include data about customers, products, employees, inventory, suppliers, and sites.

Share

Data Warehouse Subject Areas

Subject areas within a data warehouse or data mart are physical tables that are grouped together in a dimensional model or star schema that reflect general data or functional categories. Subsequently, subject areas are synonymous with functional areas and each subject area identifies and groups the data that relates to a logical area of the business.

Data Warehouse Subject Areas

Some of the subject areas that are common to most corporations and organizations include …
* Sales
* Product
* Order
* Shipment
* Work Effort
* Invoice
* Accounting
* Human Resources

Share
Business Intelligence (BI) Maturity Model - Level 5

BI Maturity Model Level 5 – Data Mining & Predictive Analytics

Overview of Data Mining & Predictive Analytics Concept

According to data-mining-guide.net, data mining is the process of analyzing large data sets in order to find patterns that can help to isolate key variables to build predictive models for management decision making.  In addition, data mining applications help discover hidden patterns and relationships in data in order to effectively project and predict future results. In order to accomplish this goal, data mining applications utilize statistics, algorithms, advanced mathematical techniques, and sophisticated data search capabilities.

Sample Data Mining ApplicationAccording to webopedia.com, predictive analytics is the practice of extracting information from existing data sets in order to determine patterns and predict future outcomes and trends.  Predictive analytics does not tell you what will happen in the future. It forecasts what might happen in the future with an acceptable level of reliability and includes what-if scenarios and risk assessment. Predictive analytics requires a high level of expertise with statistical methods and the ability to build predictive data models. As a result, it’s typically the domain of data scientists, statisticians and other skilled data analysts. The highly skilled analysts are typically supported by data engineers, who help to gather relevant data and prepare it for analysis, and by software developers and business analysts, who help with data visualization, dashboards and reports.

Fundamentally, data mining and predictive analytics tools provide answers to questions that may never have been asked and these tools are effectively able to determine relative amounts of correlation between data elements.  Further, the predictive features of data mining tools enable organizations to exploit useful patterns in data that may have otherwise been difficult to determine.

Characteristics of Data Mining & Predictive Analytics Applications

•  Leverages statistics, advanced techniques, algorithms, and sophisticated data search capabilities
•  Extrapolates past organizational performance
•  Forecasts and predicts future results of the business
•  Provides answers to questions that may never have been asked
•  Calculates levels of correlation between data elements
•  Implementers are experts of statistic analysis and/or processing of large queries

Share