Posts

Operational, Tactical, & Strategic Dashboards
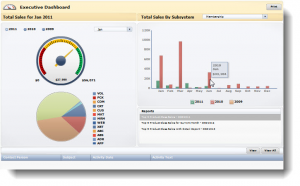
Xcelsius DashboardAs your organization seeks to better understand its customer and manage a diverse line of services and products, operational, tactical and strategic dashboards should become a critical addition to your planning and decision-making toolbox. Whether the dashboard provides your Executive Director a 30,000-foot view of the organization as a whole, or the product line manager an interactive interface which allows exploration into the details of a particular product’s performance, your organization can benefit a well-built dashboard.

Achieving accuracy and consistency for all dashboards within an organization can be both a challenging and expensive task. To this end, TMA Resources delivers three categories of dashboards to its customers to ensure that the right type of presentation is delivered to your organization’s decision–makers …

• Operational Dashboards: Continuously monitor core business processes with real-time transactional data. Alert your managers upon thresholds being exceeded or upon an exception in the data.

• Tactical Dashboards: Provide the department manager with a quick view into how his or her department is performing and highlight areas of concern—so the manager can take action to forestall less-than-optimal performance.

• Strategic Dashboards: Provide senior managers and executives with a glance of the organization’s performance in relation to strategic goals. These dashboards are typically based upon data residing in one of the organizations data warehouses or data marts and contain time-stamped snapshots of data.

Share

Components of Oracle BI Enterprise Edition (OBIEE) – Oracle Delivers

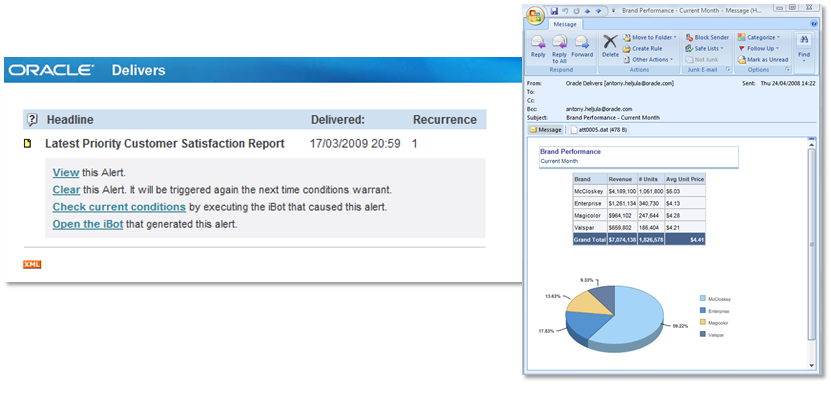
Oracle Delivers is a component of the Oracle Business Intelligence Enterprise Edition suite that provides activity monitoring and alerting that can reach users via multiple channels such as:

•  Email
•  Dashboards
•  Mobile devices

Oracle Delivers includes a web-based self-service alert creation and subscription portal, and a workflow engine that allows for initiation and passing of contextual information to other alerts. Furthermore, it can dynamically determine recipients and personalized content to reach the right users at the right time with the right information.

Oracle BI Delivers

In a nutshell, Oracle Delivers notifies business users with relevant reports and data when events occur. Notifications can be sent and received utilizing most common communication channels.

Share

Components of SAP BusinessObjects: QAAWS

Query as a Web Service (QAAWS) is a technique within the SAP Business Objects suite that allows for creation and publishing of web services.  Subsequently web services are utilized to integrate data between a Business Objects Universe and an Xcelsius Dashboard.  The QAAWS client tool provides the dashboard developer an intuitive wizard that to create universe queries and publish these queries as web services.  Once a web service is published, an Xcelsuis Dashboard can utilize and present that data. Fundamentally, QAAWS is an integration device between a Business Objects Universe and an Xcelsius Dashboard.

Query as a Web Service (QAAWS)

Query as a Web Service (QAAWS)

Share

Components of SAP BusinessObjects: Xcelsius

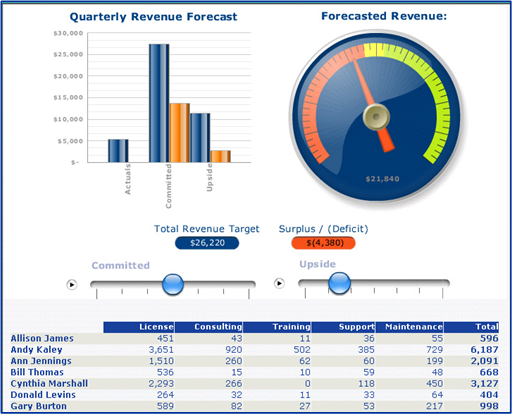
Xcelsius is the primary dashboard development tool of the SAP BusinessObjects suite of business intelligence products.  Xcelsius extends the power of business intelligence environments by offering interactive devices including gauges, charts, widgets, drop-down menus, and sliders.  These intuitive and user-friendly devices simplify the display of complex business data and provide decision makers with an easy way to interact with data and test out future business scenarios with the click of a mouse.

Sample Xcelsius Dashboard

Sample Xcelsius Dashboard

At its heart, Xcelsius is a dynamic and customizable data visualization software package that enables development of both insightful and engaging dashboards from various data sources throughout a typical organization. Moreover, Xcelsius includes graphical interfaces and real-time methods that provide guided analysis and for dynamic monitoring of organizational metrics and key performance indicators (KPIs).

Key Features of Xcelsius Dashboards Include:

•  Intuitive graphical visualizations of data.
•  Dashboard customization to meet unique business needs.
•  Connection of dashboards to any type of data source.
•  Maximization of the value of a business intelligence solution with rich user interface.
•  Deployment of dashboards within Microsoft Office, Adobe PDF, Portals, or on the Web.
•  Empowerment of decision-makers to view and understand key organizational metrics.
•  Improved user adoption of BI tools because of business-friendly visualizations.
Share

Primary Components of Business Intelligence Systems

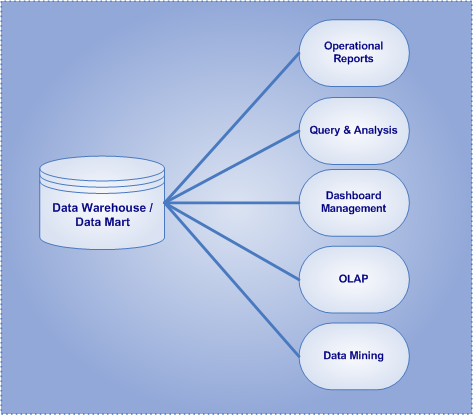
Business Intelligence (BI) systems are software applications that enable better understanding of organizational data and provide the information organizations need to make enlightened decisions. Moreover, business intelligence systems are primarily focused on reporting, querying, and analysis of data residing in an enterprise data warehouse (EDW), and both dependent and independent data marts.

Primary Components of Business Intelligence (BI)

Primary Components of Business Intelligence (BI)

Fundamentally, there are five categories of business intelligence applications…

•  Operational Reports:  Displays data with rich presentation and within a structured layout (i.e. rows and columns).
•  Query and Analysis:  Interactive methods to query data, present data in an ad-hoc manner, and to find information on an as-needed basis.
•  Dashboard Management:  Graphical interfaces and real-time methods to provide guided analysis and to intuitively monitor organizational metrics.
•  On-line Analytical Processing (OLAP):  The capability of manipulating and analyzing data from multiple perspectives in a rapid fashion.
•  Data Mining & Predictive Analytics:  Utilizing statistics, algorithms, and sophisticated data search capabilities to discover hidden patterns and relationships in data and project future results.

Read more

Share
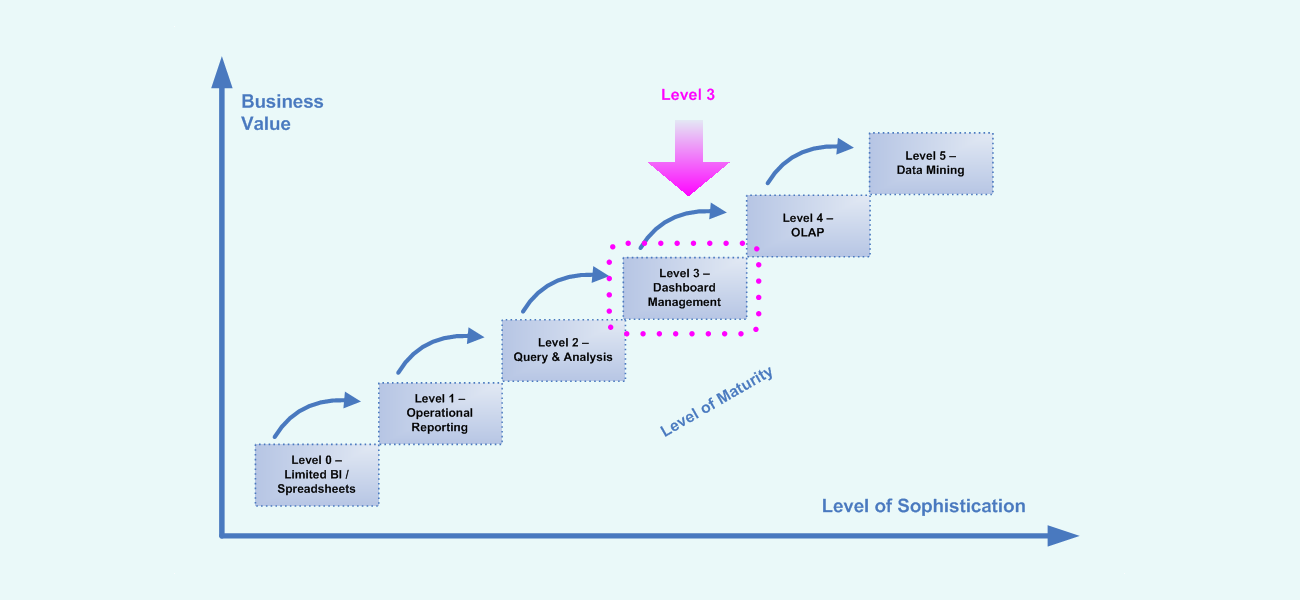
Business Intelligence (BI) Maturity Model - Level 3

BI Maturity Model Level 3 – Dashboard Management

Overview of Dashboard Management

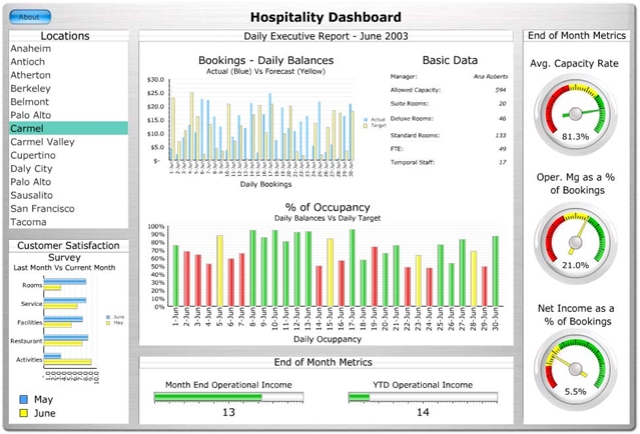
Dashboard management systems are intended to facilitate and support the information and decision-making needs of management by providing easy access to key business information in a highly graphical and intuitive format. Fundamentally, a dashboard is a graphical business tool that displays a set of KPIs (key performance indicators), metrics, and any other relevant information to a business user, manager, or key decision-maker in a single consolidated view and allows for organizational performance to be easily measured and monitored.  Dashboard data is often displayed as aggregate information and contains data that consolidated from multiple data sources scattered throughout an organization. Dashboards are commonly interactive and provide users the ability to drill into particular aspects of the display and/or rapidly switch between views of the data.

Sample Organizational Dashboard

To make this possible, dashboards are typically composed of advanced data visualization tools including charts, grids, gauges, and maps that allow for various ways of presenting information and interacting with the data. Moreover, dashboard management environments are characterized by providing users with graphical methods to view and interact with key data elements and get a snapshot of organizational performance.

Characteristics of Dashboard Management

•  Presents a number of organizational metrics in a single consolidated view
•  Presents data in graphical and intuitive format
•  Utilizes graphics, charts, grids, gauges, and maps
•  Monitors organizational metrics and key performance indicators (KPI)
•  Enables real-time visibility into data
•  Primarily utilized by senior management and key decision-makers
•  Rapidly displays a snapshot of organizational performance
Share