Posts

Components of SAP BusinessObjects: Explorer

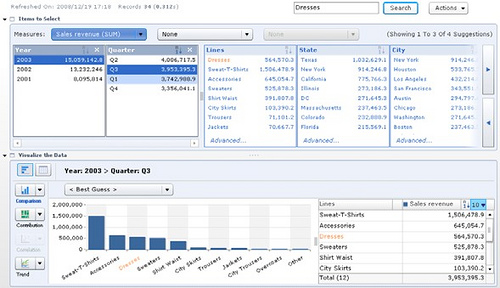
BusinessObjects Explorer is a relatively new component of the SAP BusinessObjects product suite that provides a more advanced and intuitive data exploration interface for business intelligence end-users, both casual and power users.  Explorer encompasses the simplicity and speed of web-search technologies with the trust and analytical power of conventional business intelligence technologies to provide deep understanding and immediate answers to both simple and sophisticated business questions.  BusinessObjects Explorer provides end-users with the capability of quickly exploring and visualizing large data sets.  Features includes searching and sorting, interactive drilldowns, and various types of dynamic graphical visualizations while navigating through corporate data.

SAP BusinessObjects Explorer

Features and Functions of BusinessObjects Explorer

Robust Search Capability
• Search Experience Similar to Google or Yahoo – Users enter keywords to find instant business information with return results ranked by relevance.
• Search Concurrent Data Sources – Reach data across an entire SAP BusinessObjects landscape and any data source that it accesses.
• Self-Service Access – Pervasive searches with queries directly to data without the need for a predefined report or query.
Trust and Power of a Conventional Business Intelligence System
• Guided Data Exploration – The most relevant keyword search results are presented first, allowing end-users to access additional contextually relevant details as they explore.
• Intuitive Visualization – The system automatically generates charts and grapchs that best represents the information being queries – no cryptic data model or data knowledge is required by any end-user.
• Team Collaboration – Share information easily via e-mail, embedded URL, and other popular communication formats.
Ease of Deployment to End-Users
• Leverages Existing BusinessObjects Infrastructure – Reuses existing universes, security, and administration services already deployed within the BusinessObjects platform.
• Limited End-User Training Required – Intuitive end-user interface and functionality allows first-time users to get started with next-to-no formal training.
• Rapid Implementation Schedule – Add search, exploration, and visualization functionality to an existing BusinessObjects deployment in as little as a few days.
Share

SAP BusinessObjects 4.0 E-Learning Catalog

SAP is now offering official product tutorials to assist in learning the latest SAP BusinessObjects 4.0 suite of products. Each product page acts as a dynamic library of material where content is added as it is created. Below is the list of products with available interactive and animated tutorials online. For more information on what’s available, please click here.

•  SAP Crystal Reports 2011
•  SAP Crystal Reports for Enterprise
•  SAP BusinessObjects Dashboards
•  SAP BusinessObjects Web Intelligence
•  SAP BusinessObjects Explorer
•  SAP BusinessObjects Information Design Tool
•  SAP BusinessObjects Business Intelligence Platform
•  SAP BusinessObjects Analysis (coming in Q1-2011)

Resources: SAP BI Suite ELearning Catalog

Source: http://www.pieterhendrikx.com/category/sapbo/page/3/

Share

Primary Components of Business Intelligence Systems

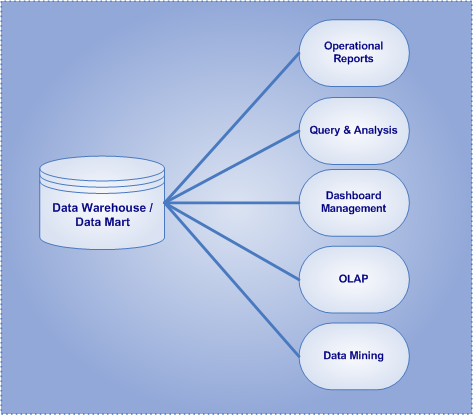
Business Intelligence (BI) systems are software applications that enable better understanding of organizational data and provide the information organizations need to make enlightened decisions. Moreover, business intelligence systems are primarily focused on reporting, querying, and analysis of data residing in an enterprise data warehouse (EDW), and both dependent and independent data marts.

Primary Components of Business Intelligence (BI)

Primary Components of Business Intelligence (BI)

Fundamentally, there are five categories of business intelligence applications…

•  Operational Reports:  Displays data with rich presentation and within a structured layout (i.e. rows and columns).
•  Query and Analysis:  Interactive methods to query data, present data in an ad-hoc manner, and to find information on an as-needed basis.
•  Dashboard Management:  Graphical interfaces and real-time methods to provide guided analysis and to intuitively monitor organizational metrics.
•  On-line Analytical Processing (OLAP):  The capability of manipulating and analyzing data from multiple perspectives in a rapid fashion.
•  Data Mining & Predictive Analytics:  Utilizing statistics, algorithms, and sophisticated data search capabilities to discover hidden patterns and relationships in data and project future results.

Read more

Share
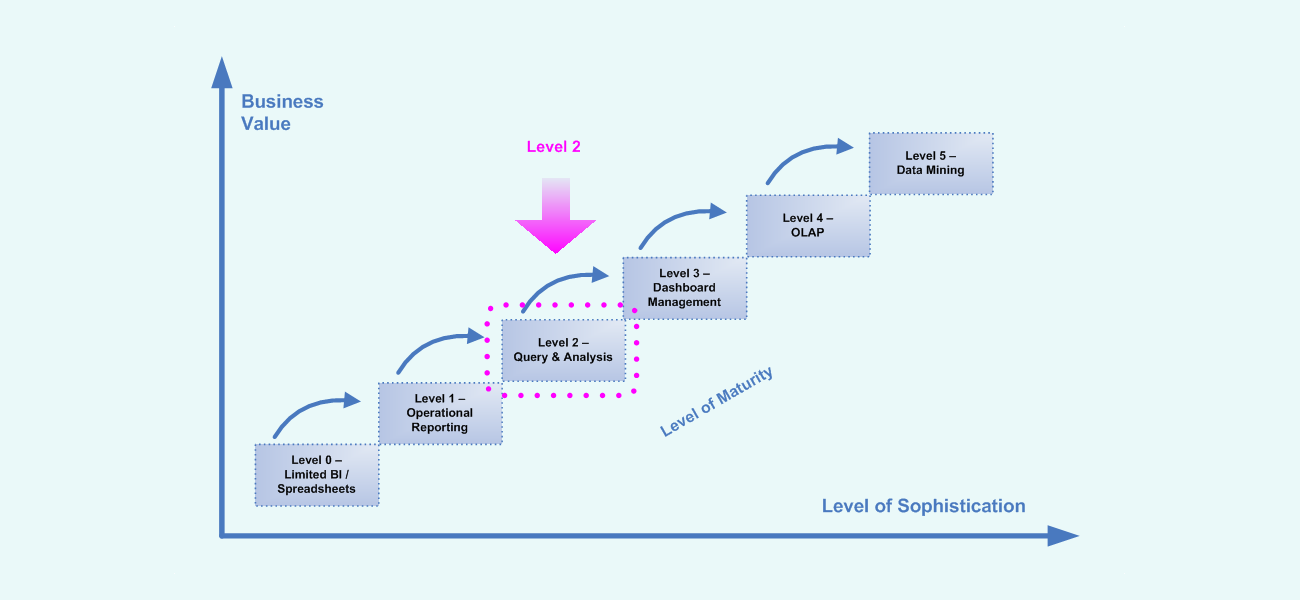
Business Intelligence (BI) Maturity Model - Level 2

BI Maturity Model Level 2 – Query & Analysis

Overview of Query & Analysis Solutions & Environments

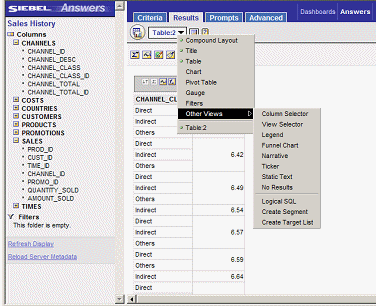
Sample Query and Analysis Solution

Sample Query and Analysis Solution

Query and analysis solutions enable business users and analysts to rapidly generate business queries and reports from enterprise data based upon business question of the data.  Also known as “ad-hoc” querying, these tools typically provide intuitive, graphical interfaces that shields users from technical complexities and allows users to leverage business terminology instead of the more technical database names. The business focus of these tools allows nontechnical professionals to be comfortable with their data and allows them to quickly and efficiently satisfy their own information needsin real time with minimal assistance from system developers. Commonly, query and analysis environments include a middleware layer that converts database conventions into business nomenclature that is more intuitive and understanding to end-users. Moreover, query & analysis environments give users the capability to access and analyze data in a unique and personal manner. Utilized primarily by business users, query and analysis solutions provide an environment that enables interactive methods to query data, present data in an ad-hoc manner, and find information on an as-needed basis.


Characteristics of Query & Analysis Environments

•  Utilized primarily by business users
•  Drag-n-drop interfaces to create queries and simple reports
•  Rapidly and intuitively generate queries with minimal help from IT professionals
•  Highly-interactive methods to query data
•  Users ask business questions to develop queries
•  To produce queries, users only need to understand their own business terms
•  Users can independently dive into the details of their data
Share