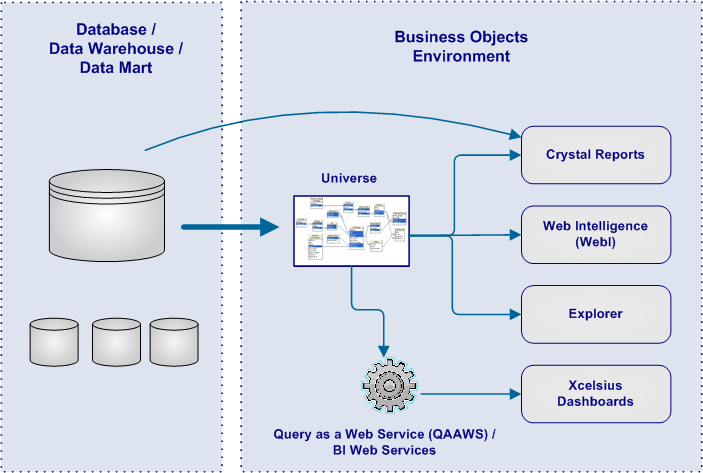
- Rather than being one independent tool, SAP BusinessObjects delivers a comprehensive suite of products that provide business intelligence functionality to empower users to make effective, informed decisions based on solid data and analysis. All users, from the high-end analyst to the casual business user, are enabled with access to the information they need. Capabilities within the SAP BusinessObjects product suite include operational reporting, ad-hoc query and analysis, exploration, visualization, dashboards, and related middleware. Moreover, the main way that data is sourced from a database is through a middleware or semantic layer known as a universe and dashboards access data from the universe through either QAAWS or BI Web Services integration devices.
- Components of SAP BusinessObjects Product Suite
- • Operational Reporting: Crystal Reports
- • Ad Hoc Query and Analysis: Web Intelligence (WebI)
- • Data Exploration: Explorer
- • Dashboards: Xcelsius
- • Database Middleware: Universes
- • Dashboard Integration: QAAWS, BI Web Services
BusinessObjects Component: Crystal Reports
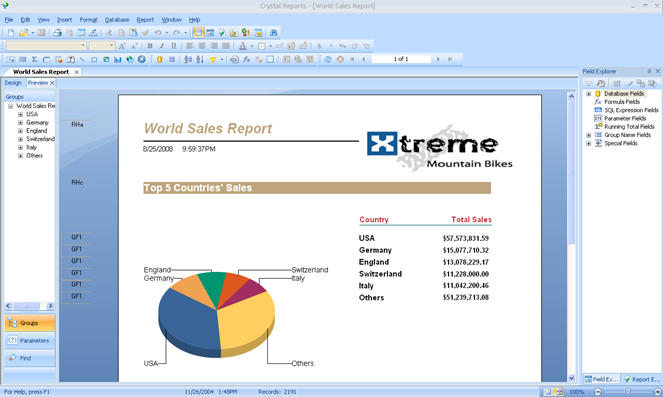
Crystal Reports is an operational reporting environment and is a tool that enables report authors to easily design interactive reports and connect them to virtually any data source. It is the ideal solution for canned or published reports as it allows for the creation of high-fidelity, pixel-perfect reports. Additionally, end-users benefit from on-report sorting and filtering – giving them the power to execute decisions instantly.
With Crystal Reports, report authors and end-users can leverage an intuitive interface, access data spread across multiple systems, design reports with guided interactivity, and embed reports within both client-server and web applications. Crystal Reports can be used for report design, application development, and web report delivery.
BusinessObjects Component: Web Intelligence (WebI)
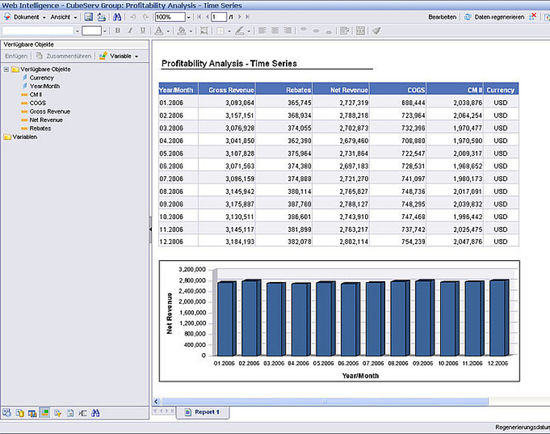
Web Intelligence (WebI) is an ad-hoc query and reporting environment within the SAP BusinessObjects suite of products. Fundamentally, it is an environment that provides self-service access to data. Web Intelligence contains reporting, querying, and information analysis in one integrated product, helping your users turn business insights into effective decisions. With just a few clicks of the mouse, WebI users can quickly access and format information as well as easily analyze information to understand underlying trends and root causes.
Web Intelligence contains a highly-interactive data interface that allows the report user a great deal of flexibility to view data from different perspectives. Although many report users may only need to build their reports from scratch, it is often necessary for the users to adjust reports to answer current business questions. With Web Intelligence, users can easily edit queries and reports to reflect their latest information needs.
- The following options can be taken advantage by user of Web Intelligence …
- • View, edit, remove report, section, or block filters
- • Format and re-size cells, tables, and charts
- • Set breaks and sorts
- • Insert calculations
- • Add rows and columns to tables
- • Create and duplicate tables and charts
- • Turn a grid into a chart or a chart into a grid
- • Create formulas and variables
- • Edit cell formulas in place
- • Recombine report objects within tables and charts
- Web Intelligence empowers users with self-service information retrieval and interactivity, while providing:
- • Ability to generate answers to business questions
- • Thorough business and data analysis
- • An environment that utilizes business terminology rather than cryptic technical jargon
- • Intuitive drag & drop interface for document creation
BusinessObjects Component: Explorer
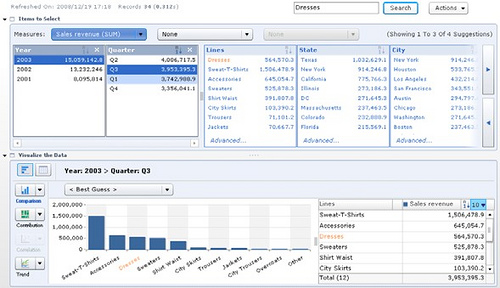
BusinessObjects Explorer is a relatively new component of the SAP BusinessObjects product suite that provides a more advanced and intuitive data exploration interface for business intelligence end-users, both casual and power users. Explorer encompasses the simplicity and speed of web-search technologies with the trust and analytical power of conventional business intelligence technologies to provide deep understanding and immediate answers to both simple and sophisticated business questions. BusinessObjects Explorer provides end-users with the capability of quickly exploring and visualizing large data sets. Features includes searching and sorting, interactive drilldowns, and various types of dynamic graphical visualizations while navigating through corporate data.
- Features and Functions of BusinessObjects Explorer:
- • Search Experience Similar to Google or Yahoo – Users enter keywords to find instant business information with return results ranked by relevance.
- • Search Concurrent Data Sources – Reach data across an entire SAP BusinessObjects landscape and any data source that it accesses.
- • Self-Service Access – Pervasive searches with queries directly to data without the need for a predefined report or query.
- • Guided Data Exploration – The most relevant keyword search results are presented first, allowing end-users to access additional contextually relevant details as they explore.
- • Intuitive Visualization – The system automatically generates charts and grapchs that best represents the information being queries – no cryptic data model or data knowledge is required by any end-user.
- • Team Collaboration – Share information easily via e-mail, embedded URL, and other popular communication formats.
- • Leverage Existing BusinessObjects Infrastructure – Reuses existing universes, security, and administration services already deployed within the BusinessObjects platform.
- • Limited End-User Training Required – Intuitive end-user interface and functionality allows first-time users to get started with next-to-no formal training.
- • Rapid Implementation Schedule – Add search, exploration, and visualization functionality to an existing BusinessObjects deployment in as little as a few days.
BusinessObjects Component: Xcelsius
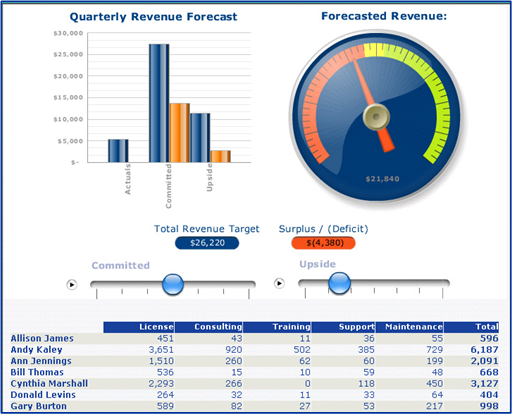
At its heart, Xcelsius is a dynamic and customizable data visualization software package that enables development of both insightful and engaging dashboards from various data sources throughout a typical organization. Moreover, Xcelsius includes graphical interfaces and real-time methods that provide guided analysis and for dynamic monitorring of organizational metrics and key performance indicators (KPIs).
At its heart, Xcelsius is a dynamic and customizable data visualization software package that enables development of both insightful and engaging dashboards from various data sources throughout a typical organization. Moreover, Xcelsius includes graphical interfaces and real-time methods that provide guided analysis and for dynamic monitoring of organizational metrics and key performance indicators (KPIs).
- Key Features of Xcelsius Dashboards Include:
- • Building of intuitive graphical visualizations of data.
- • Customization of dashboards to meet unique business needs.
- • Connection of dashboards to any type of data source.
- • Maximization of the value of a business intelligence solution with rich user interface.
- • Deployment of dashboards within Microsoft Office, Adobe PDF, Portals, or on the Web.
- • Empowerment of decision-makers to view and understand key organizational metrics.
- • Improved user adoption of BI tools because of business-friendly visualizations.
BusinessObjects Component: Universes
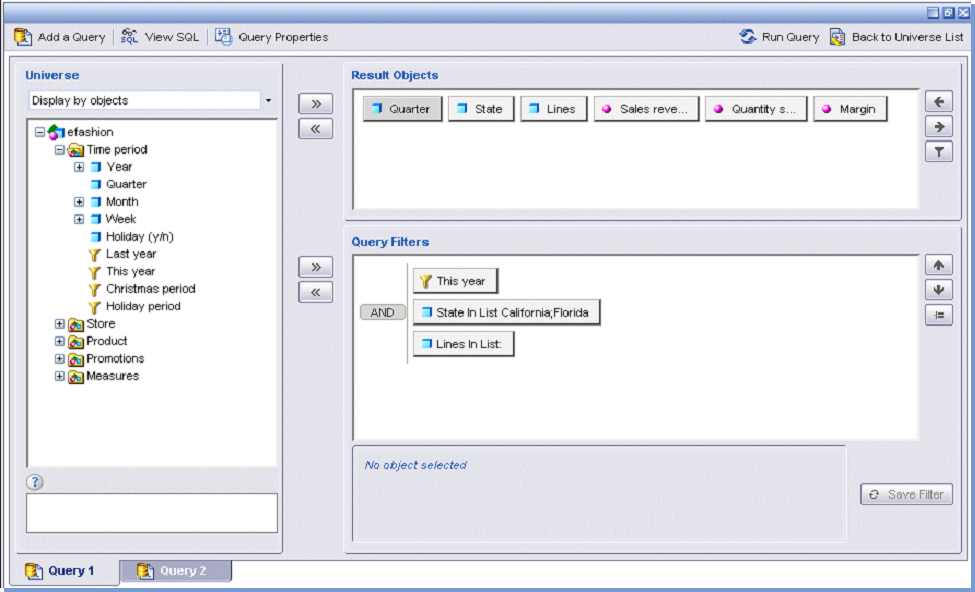
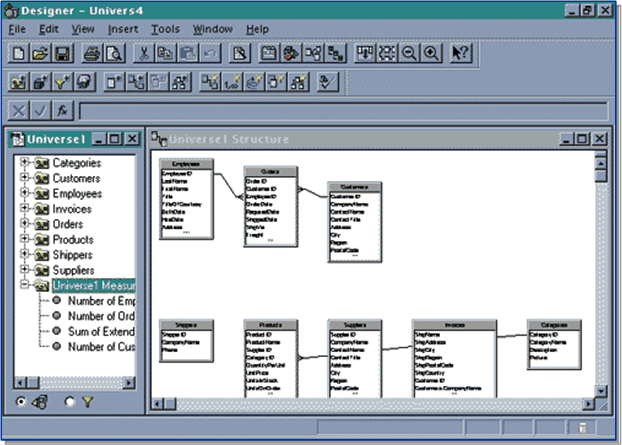
A BusinessObjects Universe is a middleware device that contains a business representation of a data warehouse, data marts, or other reporting database. Fundamentally, the universe enables the end-user of BusinessObjects to interact with data without having to understand the complexities of database logic or be familiar with where the physical data is stored. Moreover, the universe is built around common business terminology that describes the business environment and provides the end-user the ability to intuitively query and retrieve exactly the data that they need.
Also known as a “semantic layer”, the universe is an intermediary layer between a database or data source and dependent reports, queries, or dashboards. The universe is a requirement as a data source for WebIntelligence and Xcelsius dashboards, while being optional as a data source for Crystal Reports. Additionally a universe is developed using the BusinessObjects Designer tool.
- Components of a Universe Include:
- • Classes – Logical groupings of fields and objects
- • Tables – Mappings to database tables and views
- • Objects – Structures that map to database fields
- • Joins – SQL specifications on how tables relate (contains both inner and outer join information)
- • Contexts – Groups of related tables with their related joins
BusinessObjects Component: QAAWS
Query as a Web Service (QAAWS) is a technique within the SAP Business Objects suite that allows for creation and publishing of web services. Subsequently web services are utilized to integrate data between a Business Objects Universe and an Xcelsius Dashboard. The QAAWS client tool provides the dashboard developer an intuitive wizard that to create universe queries and publish these queries as web services. Once a web service is published, an Xcelsuis Dashboard can utilize and present that data. Fundamentally, QAAWS is an integration device between a Business Objects Universe and an Xcelsius Dashboard.

