
Commonly Used Machine Learning Algorithms & Techniques
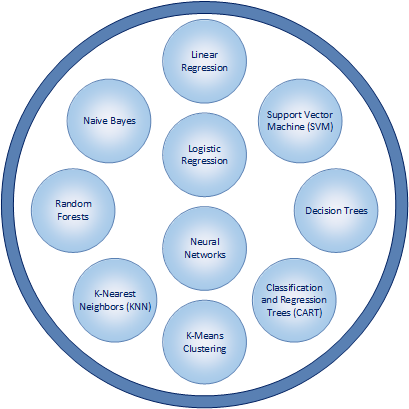
Just as there are numerous practical applications of machine learning, there are also a wide variety of algorithms and statistical modeling techniques that help enable implementations of machine learning to be effective. Some of the most commonly used algorithms and statistical modeling techniques for machine learning include:
1) Linear Regression: Enables the summary and study of relationships between two continuous, quantitative variables: Linear regression enables the modeling of the relationship between two variables by utilizing a linear equation (i.e. y = f(x)). One variable is considered to be an explanatory variable, and the other is considered to be a dependent variable. Linear regression is one of the most basic ways of conducting statistical modeling and is typically one of the first ways that is utilized.
2) Logistic Regression: Analyzes data in which there are one or more independent variables that determine an outcome. The outcome is measured with a binary or dichotomous variable (usually in the format of 0 and 1). Logistic regression focuses on estimating the probability of an event occurring based on the data that has been previously provided. And the goal of logistic regression is to find the best fitting model to describe the relationship between the dichotomous dependent variable and a set of independent variables.
3) Decision Trees: Uses observations about certain actions and identifies an optimal path for arriving at a desired outcome. Decision trees model decisions and their possible consequences in a binary tree-like format with two conditions for each decision. A decision tree is a flowchart-like structure that enable analysis to go from observations about an item to conclusions about the item’s target value. Observations are represented in the branches while conclusions are represented in leaves. The paths from tree root to individual leaves represent classification rules.
4) Classification and Regression Trees (CART): Two similar ways of conducting an implementation of decision trees. Rather than using a statistical equation, a binary tree-structure is constructed and is used to determine an outcome. Classification trees are used when the predicted outcome is the grouping of data to which the data belongs. Regression tree are used when the predicted outcome contains a numeric or real number value (e.g. the price of a car, salary amount, value of a financial investment).
5) K-Means Clustering: Used to categorize data without previously defined categories or groups. The algorithm works by finding groups with similar characteristics within the data, with the number of groups represented by the user-defined variable K. And the groups of data are known as clusters. The modeling technique then works in an iterative manner to assign each data point to one of K clusters.
6) K-Nearest Neighbors (KNN): Estimates how likely a data point is to be a member of one group or another. Predictions are made for a data point by searching through the entire data set to find the K-nearest groupings of data with related characteristics to the data point. The groupings of data with related common characteristics that are similar to the characteristics of the data point are known as neighbors. The value of K is user-specified and a similarity measure or distance function is used to determine how close neighbors are to each other.
7) Random Forests: Combine multiple algorithms to generate better results for classification and regression. Each individual classification is fairly weak. But much stronger with more accurate results when combined with other classifications. Random forests include a decision tree that incorporates random selections. Each tree is constructed using a random sample of records and each split is constructed using a random sample of variables. The number of variables to be searched at each split point is user-specified.
8) Naive Bayes: Classifies every value as independent of any other value and is based upon the Bayes theorem of calculating probability. Further, the algorithm enables a classifications or groupings of data to be predicted, based on a given set of variables and probability. A Naive Bayesian model is fairly easy to build, with no complicated iterative parameter estimation. It is particularly useful for very large data sets.
9) Support Vector Machine (SVM): A method of classification in which data values are plotted as points on a graph. The value of each feature of the data is then identified with a particular coordinate on a graph. SVM includes the construction of hyperplanes on a graph which assists in the identification of groupings of data, relationships between data, and data outliers.
10) Neural Networks: Loosely designed on the human brain and includes the sophisticated ability to recognize patterns. Neural networks utilize large amounts of data to identify correlations between many variables. Moreover, neural networks possess the ability the to learn how to process future incoming data. The patterns that neural networks recognize are numerical and contained in vectors. And vectors are the mathematical translation of all real-world data including voice, graphics, sounds, video, text, and time. Neural networks are very effective in learning by example and through experience. They are extremely useful for modelling non-linear relationships in data sets and when the relationship among the input variables is difficult to determine.

Leave a Reply
Want to join the discussion?Feel free to contribute!