Posts

New Product Names within SAP BusinessObjects Version 4.0

The latest version of SAP Business Objects, released in 2011, has been officially named SAP BusinessObjects 4.0 with the title “XI” being removed from the release number. Many of the client tools in the SAP Business Objects application suite will also have a new name in the new version.

Business Objects Application Names for BOBJ XI 3.x vs. BOBJ 4.0

Business Objects (BOBJ) 4.0 - New Application Names

Source: http://bit.ly/gVurCF

Share

Components of SAP BusinessObjects: Universes

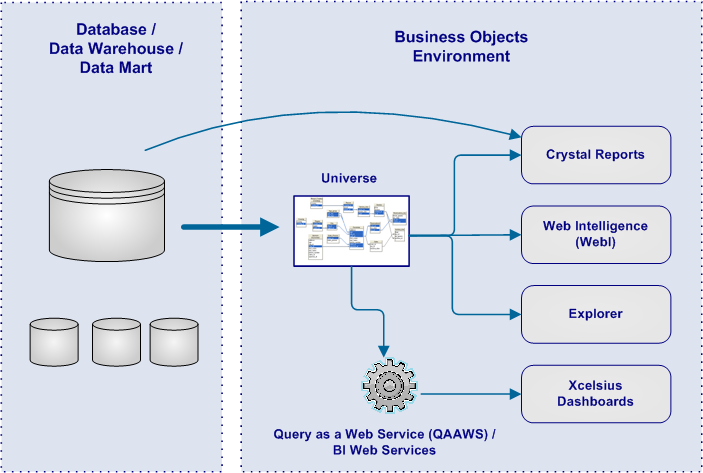
A BusinessObjects Universe is a middleware device that contains a business representation of a data warehouse, data marts, or other reporting database. Fundamentally, the universe enables the end-user of BusinessObjects to interact with data without having to understand the complexities of database logic or be familiar with where the physical data is stored. Moreover, the universe is built around common business terminology that describes the business environment and provides the end-user the ability to intuitively query and retrieve exactly the data that they need.

Also known as a “semantic layer”, the universe is an intermediary layer between a database or data source and dependent reports, queries, or dashboards.  The universe is a requirement as a data source for WebIntelligence and Xcelsius dashboards, while being optional as a data source for Crystal Reports.

Role of Business Objects Universe

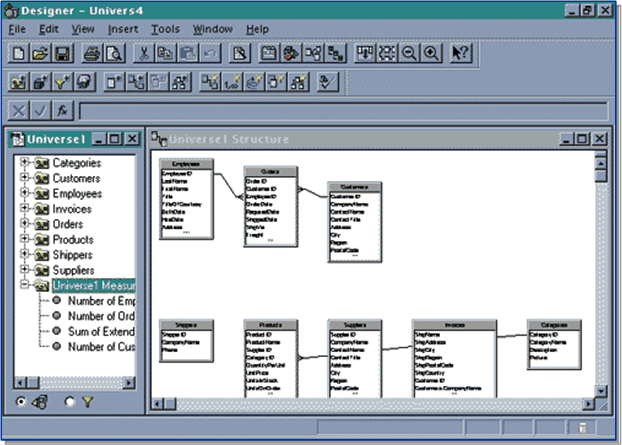
A universe is developed using the BusinessObjects Designer tool and a universe file (.unv) contains:
•  Database connection information
•  Objects grouped into classes seen by the users
•  Objects that map to database structures
•  A schema of tables and joins based on the database
Components of a Universe Include:
•  Classes – Logical groupings of fields and objects
•  Tables – Mappings to database tables and views
•  Objects – Structures that map to database fields
•  Joins – SQL specifications on how tables relate (contains both inner and outer join information)
•  Contexts – Groups of related tables with their related joins

Universe within BusinessObjects Designer

Key Advantages of Utilizing a BusinessObjects Universe:
•  Only the universe developer needs to understand the structure of the underlying database.
•  Cryptic database jargon is hidden from end-users
•  The designer tool allows the creation of the universe in an easy-to-use graphical interface.
•  The data is read-only so there is no danger of the data being edited or changed by the end user.
•  Reports can be created using a simple interface using drag and drop techniques.
•  All data fields utilize consistent business terminology.
•  Standards can be applied across data fields
Share

Components of SAP BusinessObjects: Web Intelligence (WebI)

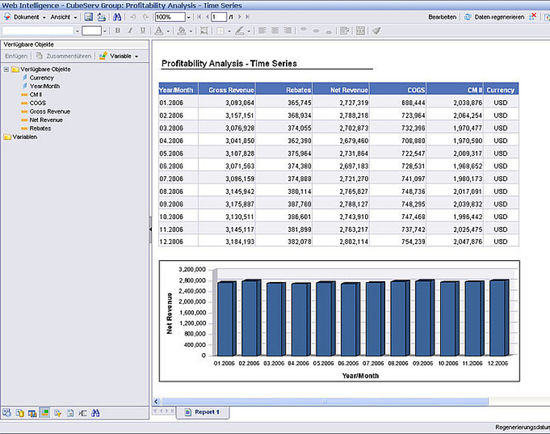
Web Intelligence (WebI) is an ad-hoc query and reporting environment within the SAP BusinessObjects suite of products. Fundamentally, it is an environment that provides self-service access to data.  Web Intelligence contains reporting, querying, and information analysis in one integrated product, helping end-users turn business insights into effective decisions.  With just a few clicks of the mouse, WebI users can quickly access and format information as well as easily analyze information to understand underlying trends and root causes.

Web Intelligence contains a highly-interactive data interface that allows the report user a great deal of flexibility to view data from different perspectives.  Although many report users may only need to build their reports from scratch, it is often necessary for the users to adjust reports to answer current business questions. With Web Intelligence, users can easily edit queries and reports to reflect their latest information needs.

WebInteligence (WebI) - Sample Report

WebInteligence (WebI) – Sample Report

The following options can be taken advantage by user of Web Intelligence …
• View, edit, remove report, section, or block filters
• Format and re-size cells, tables, and charts
• Set breaks and sorts
• Insert calculations
• Add rows and columns to tables
• Create and duplicate tables and charts
• Turn a grid into a chart or a chart into a grid
• Create formulas and variables
• Edit cell formulas in place
• Recombine report objects within tables and charts

Read more

Share

Components of SAP BusinessObjects: Crystal Reports

Crystal Reports is an operational reporting environment and component of the SAP BusinessObjects suite of products.  Fundamentally, it is a tool that enables report authors to easily design interactive reports and connect them to virtually any data source. It is the ideal solution for canned or published reports as it allows for the creation of high-fidelity, pixel-perfect reports. Additionally, end-users benefit from on-report sorting and filtering – giving them the power to execute decisions instantly.

More details and graphics of Crystal Reports can be found on the Portfolio Page.
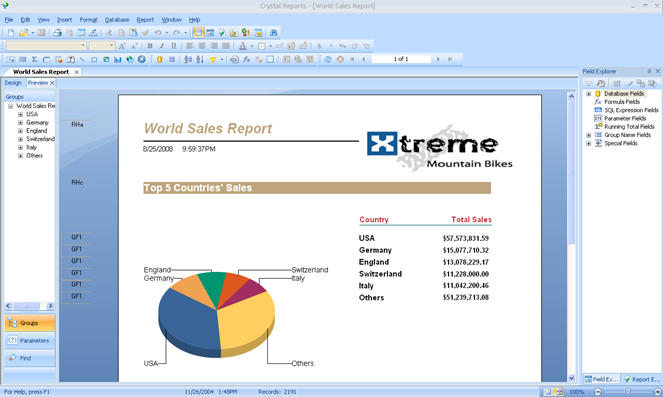
Crystal Reports - Sample Report in Designer Tool

Crystal Reports – Sample Report in Designer Tool

With Crystal Reports, report authors and end-users can leverage an intuitive interface, access data spread across multiple systems, design reports with guided interactivity, and embed reports within both client-server and web applications.  Crystal Reports can be used for report design, application development, and web report delivery.

Read more

Share

Components of SAP BusinessObjects: Xcelsius

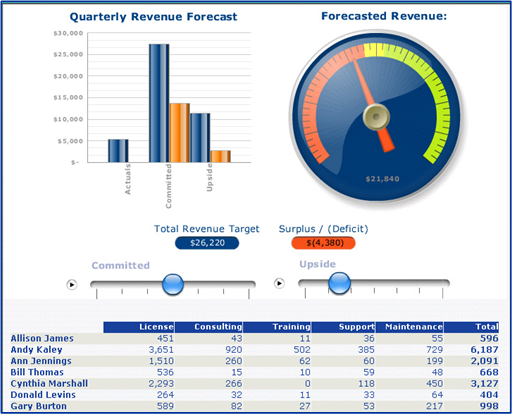
Xcelsius is the primary dashboard development tool of the SAP BusinessObjects suite of business intelligence products.  Xcelsius extends the power of business intelligence environments by offering interactive devices including gauges, charts, widgets, drop-down menus, and sliders.  These intuitive and user-friendly devices simplify the display of complex business data and provide decision makers with an easy way to interact with data and test out future business scenarios with the click of a mouse.

Sample Xcelsius Dashboard

Sample Xcelsius Dashboard

At its heart, Xcelsius is a dynamic and customizable data visualization software package that enables development of both insightful and engaging dashboards from various data sources throughout a typical organization. Moreover, Xcelsius includes graphical interfaces and real-time methods that provide guided analysis and for dynamic monitoring of organizational metrics and key performance indicators (KPIs).

Key Features of Xcelsius Dashboards Include:

•  Intuitive graphical visualizations of data.
•  Dashboard customization to meet unique business needs.
•  Connection of dashboards to any type of data source.
•  Maximization of the value of a business intelligence solution with rich user interface.
•  Deployment of dashboards within Microsoft Office, Adobe PDF, Portals, or on the Web.
•  Empowerment of decision-makers to view and understand key organizational metrics.
•  Improved user adoption of BI tools because of business-friendly visualizations.
Share