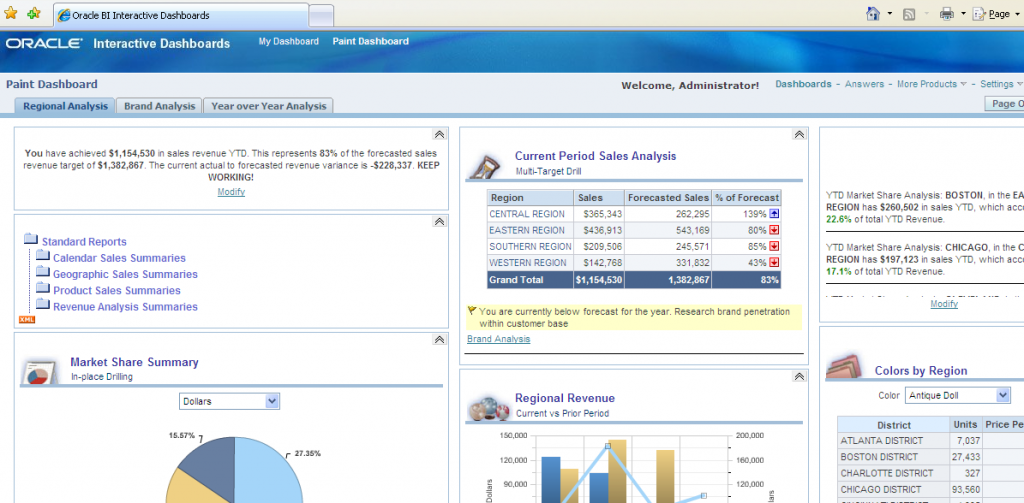
Components of Oracle BI Enterprise Edition (OBIEE) – Oracle Interactive Dashboards
- Oracle Interactive Dashboards is a presentation component of the Oracle Business Intelligence Enterprise Edition (OBIEE) suite and provides versatile, web-based dashboards that displays information in a highly-intuitive format to help end-users’ decision making. The user interface is completely graphical while access to the information is interactive and based on the individual’s role and identity. Further, the user has full capability for modifying and interacting with data utilizing the following controls …
- • Live reports
- • Charts
- • Tables
- • Prompts
- • Pivot tables
Additionally, the Oracle Interactive Dashboards provides the user with full capability of drilling, navigating, modifying, and interacting with data sets. This concept is commonly referred to as “guided analysis“. Oracle Interactive Dashboards can retrieve and aggregate content from a wide variety of sources, including the traditional databases, data warehouses and data marts, shared file servers, and document repositories.
Oracle Interactive Dashboards provide personalized views of corporate and external information. A dashboard consists of one or more pages, which appear as tabs across the top of the dashboard. Pages can display anything that you can access or open with your Web browser, such as saved queries and requests, alerts from Oracle Delivers, images, charts, tables, text, and links to Web sites and documents.


Leave a Reply
Want to join the discussion?Feel free to contribute!