Business Intelligence Capability – Data Visualization
Overview of Data Visualization Solutions
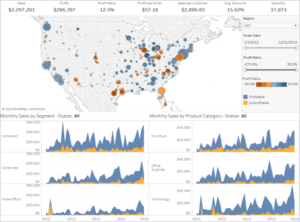
Data Visualization Solutions enable analysis by providing highly-graphical representations of information and data. By using visual elements including charts, graphs, and maps, data visualization is an accessible way to see and understand trends, outliers, and patterns in data. Further, data visualization refers to the techniques used to communicate data or information by encoding it as visual objects contained within graphics.
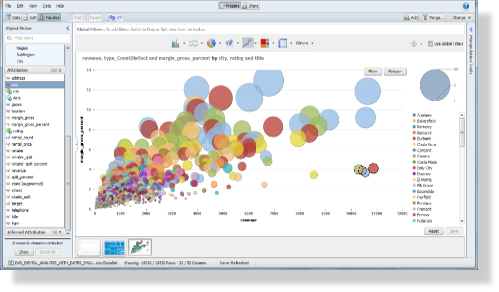
Data visualization tools go beyond the display of basic charts and graphs. Moreover, they display data in more sophisticated ways such as geographic maps, infographics, dials, gauges, sparklines, heat maps, networks, graphs, and charts. The images may include interactive capabilities, enabling users to manipulate them or drill into the data for querying and analysis. Additionally, numerical data may be encoded within graphics using dots, lines, circles, bubbles, or bars, to visually communicate a quantitative message. Indicators designed to alert users when data has been updated or predefined conditions occur can also be included. Because of the way the human brain processes information, using graphics to visualize large amounts of data is for more effective for rapid analysis then just looking at data within queries and reports. Effective data visualization assists users to analyze and reason about data and to draw conclusions. These types of analytical tools make complex data sets more intuitive, understandable, and usable for decision-making.
Characteristics of Data Visualization Solutions
- • Highly graphical presentation of data.
- • Intuitive user interface with visual presentation of data.
- • Rapid comprehension of data.
- • Comparison of different pieces of data.
- • Ease of interpretation of data.
- • Quantitative evaluation of data.
- • Presents numerous numerical metrics in a relatively small space.
- • Numerical data encoded within graphics using dots, lines, circles, bubbles, or bars.
- • Reveals data at several levels of detail and perspectives.
- • Indication of data relationships, patterns, and outliers.
- • Makes large data sets coherent.
- • Enables analysis of trends.
- • Identification of data indicators.
- • Conversion of data into information.


